Oh, so much wind! A historical perspective for Denver and the U.S.

Yes, it has been windy. And, it is safe to say it has been windier than normal around Denver and the Front Range in the past couple of months.
It's important to keep things in perspective, so let's look at this from a top down approach, if you will.
Wind events are common along the leeside of the Rocky Mountains, but what makes this recent pattern unusual is the scope of the winds across the U.S. as well as the frequency of strong wind events here in the city.
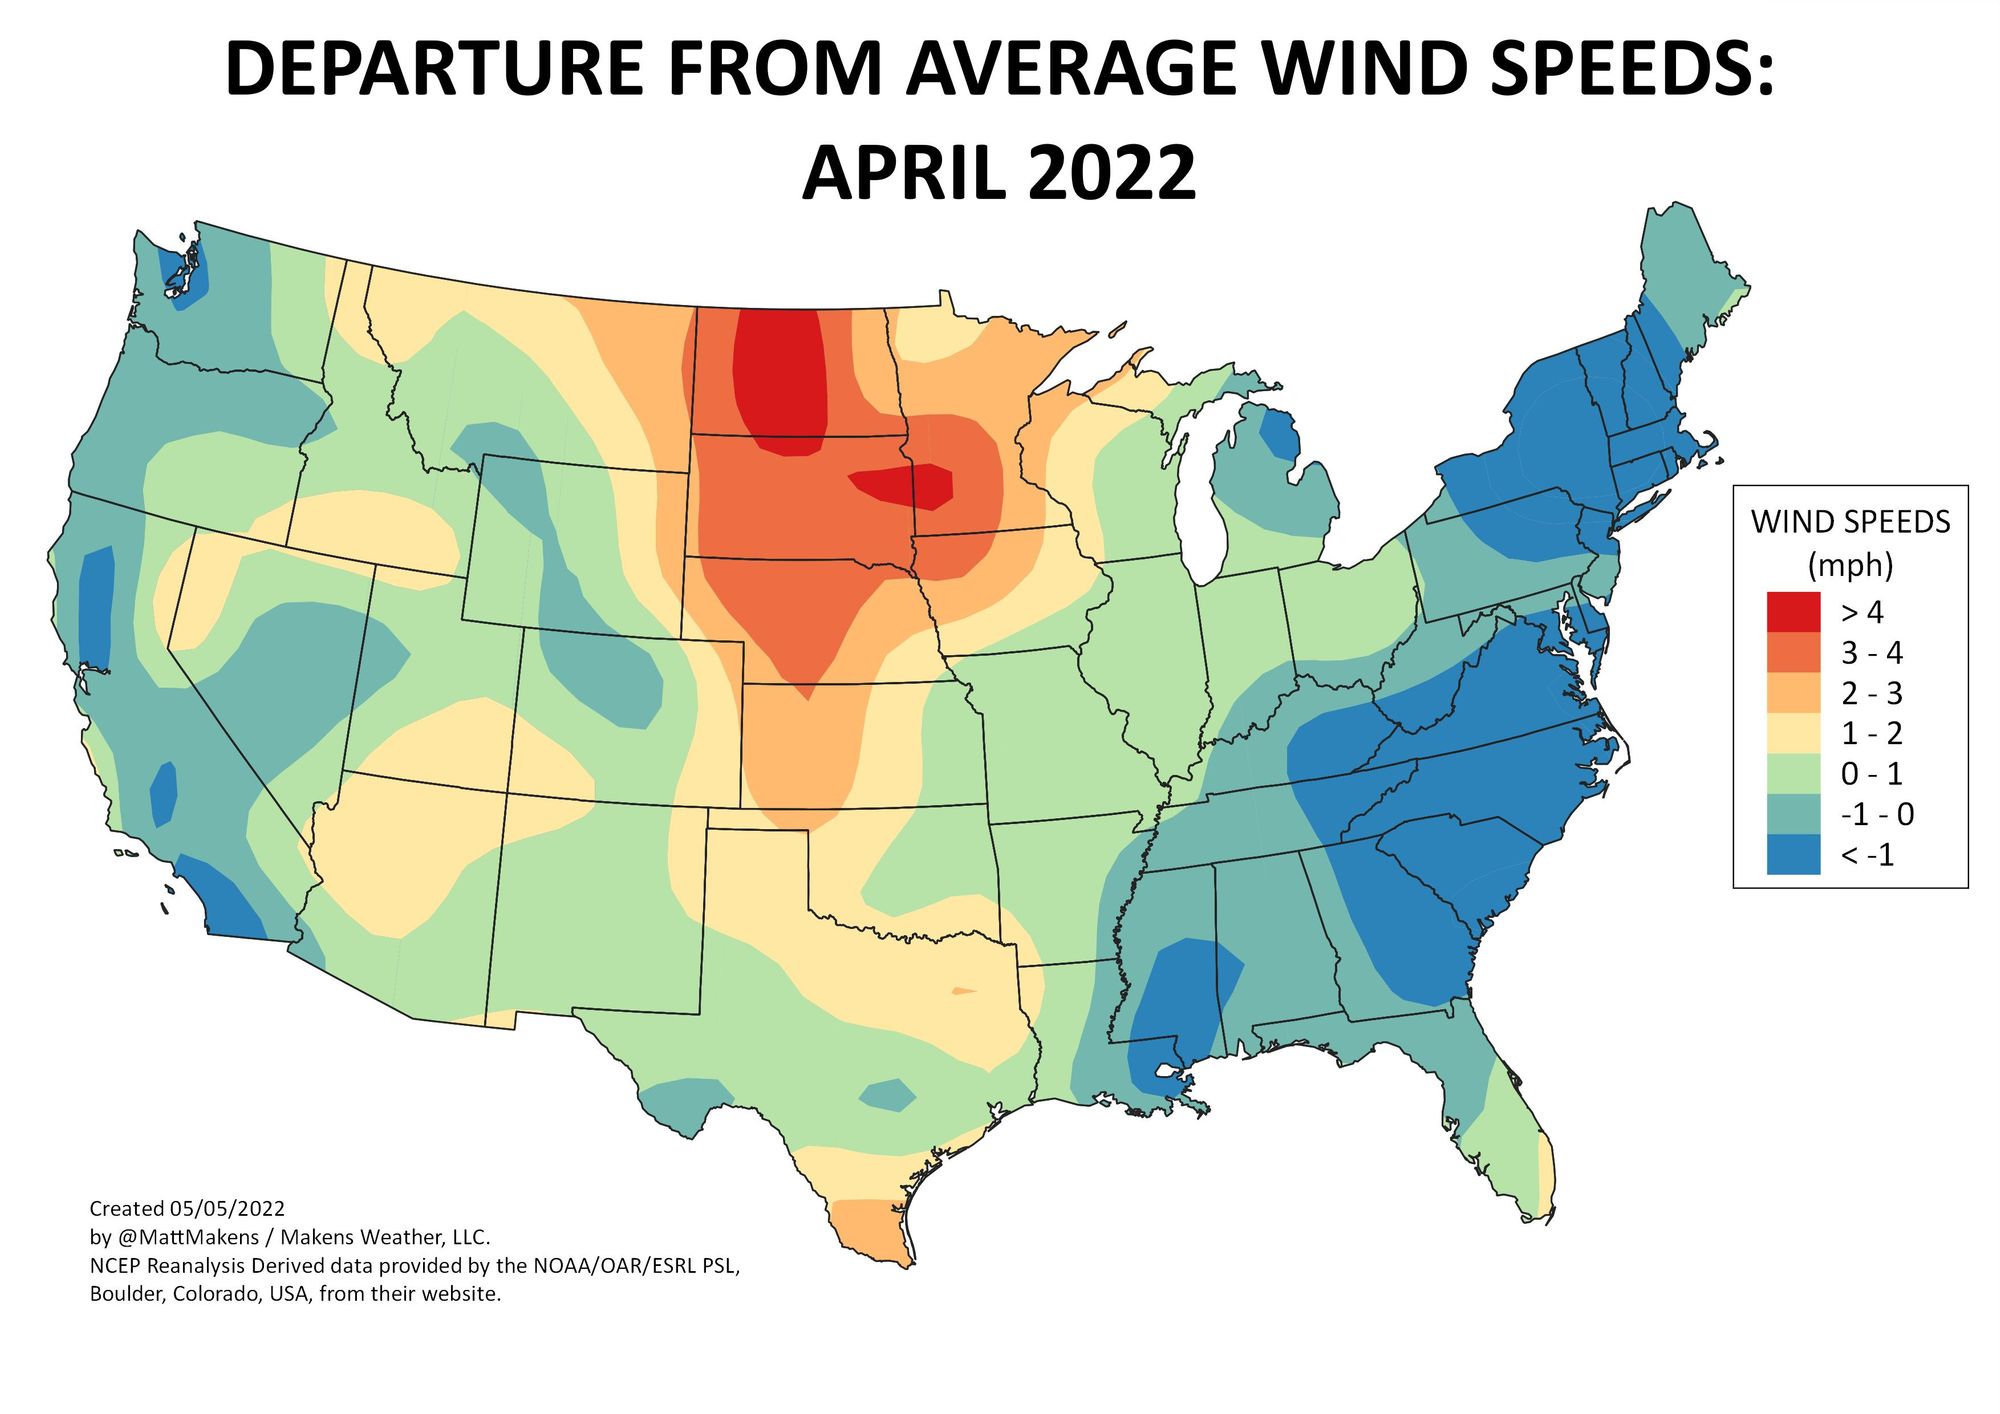
To begin, let's take a look at April's average surface wind speed departure from normal.

To frame that in perspective, there is a reason we are windier: La Nina.
La Niña remains 'tough.' In April, the SOI (one of many measures of a La Niña orientation) was the second strongest observed since 1951. The strongest being 2011, followed by 1971, 1989 and 1999. She's going to continue with us for a while...#climate #drought #beef #ag pic.twitter.com/PRm922wJBI
— Matt Makens (@MattMakens) May 5, 2022
Comparing La Nina wind anomalies to those during El Nino we have:
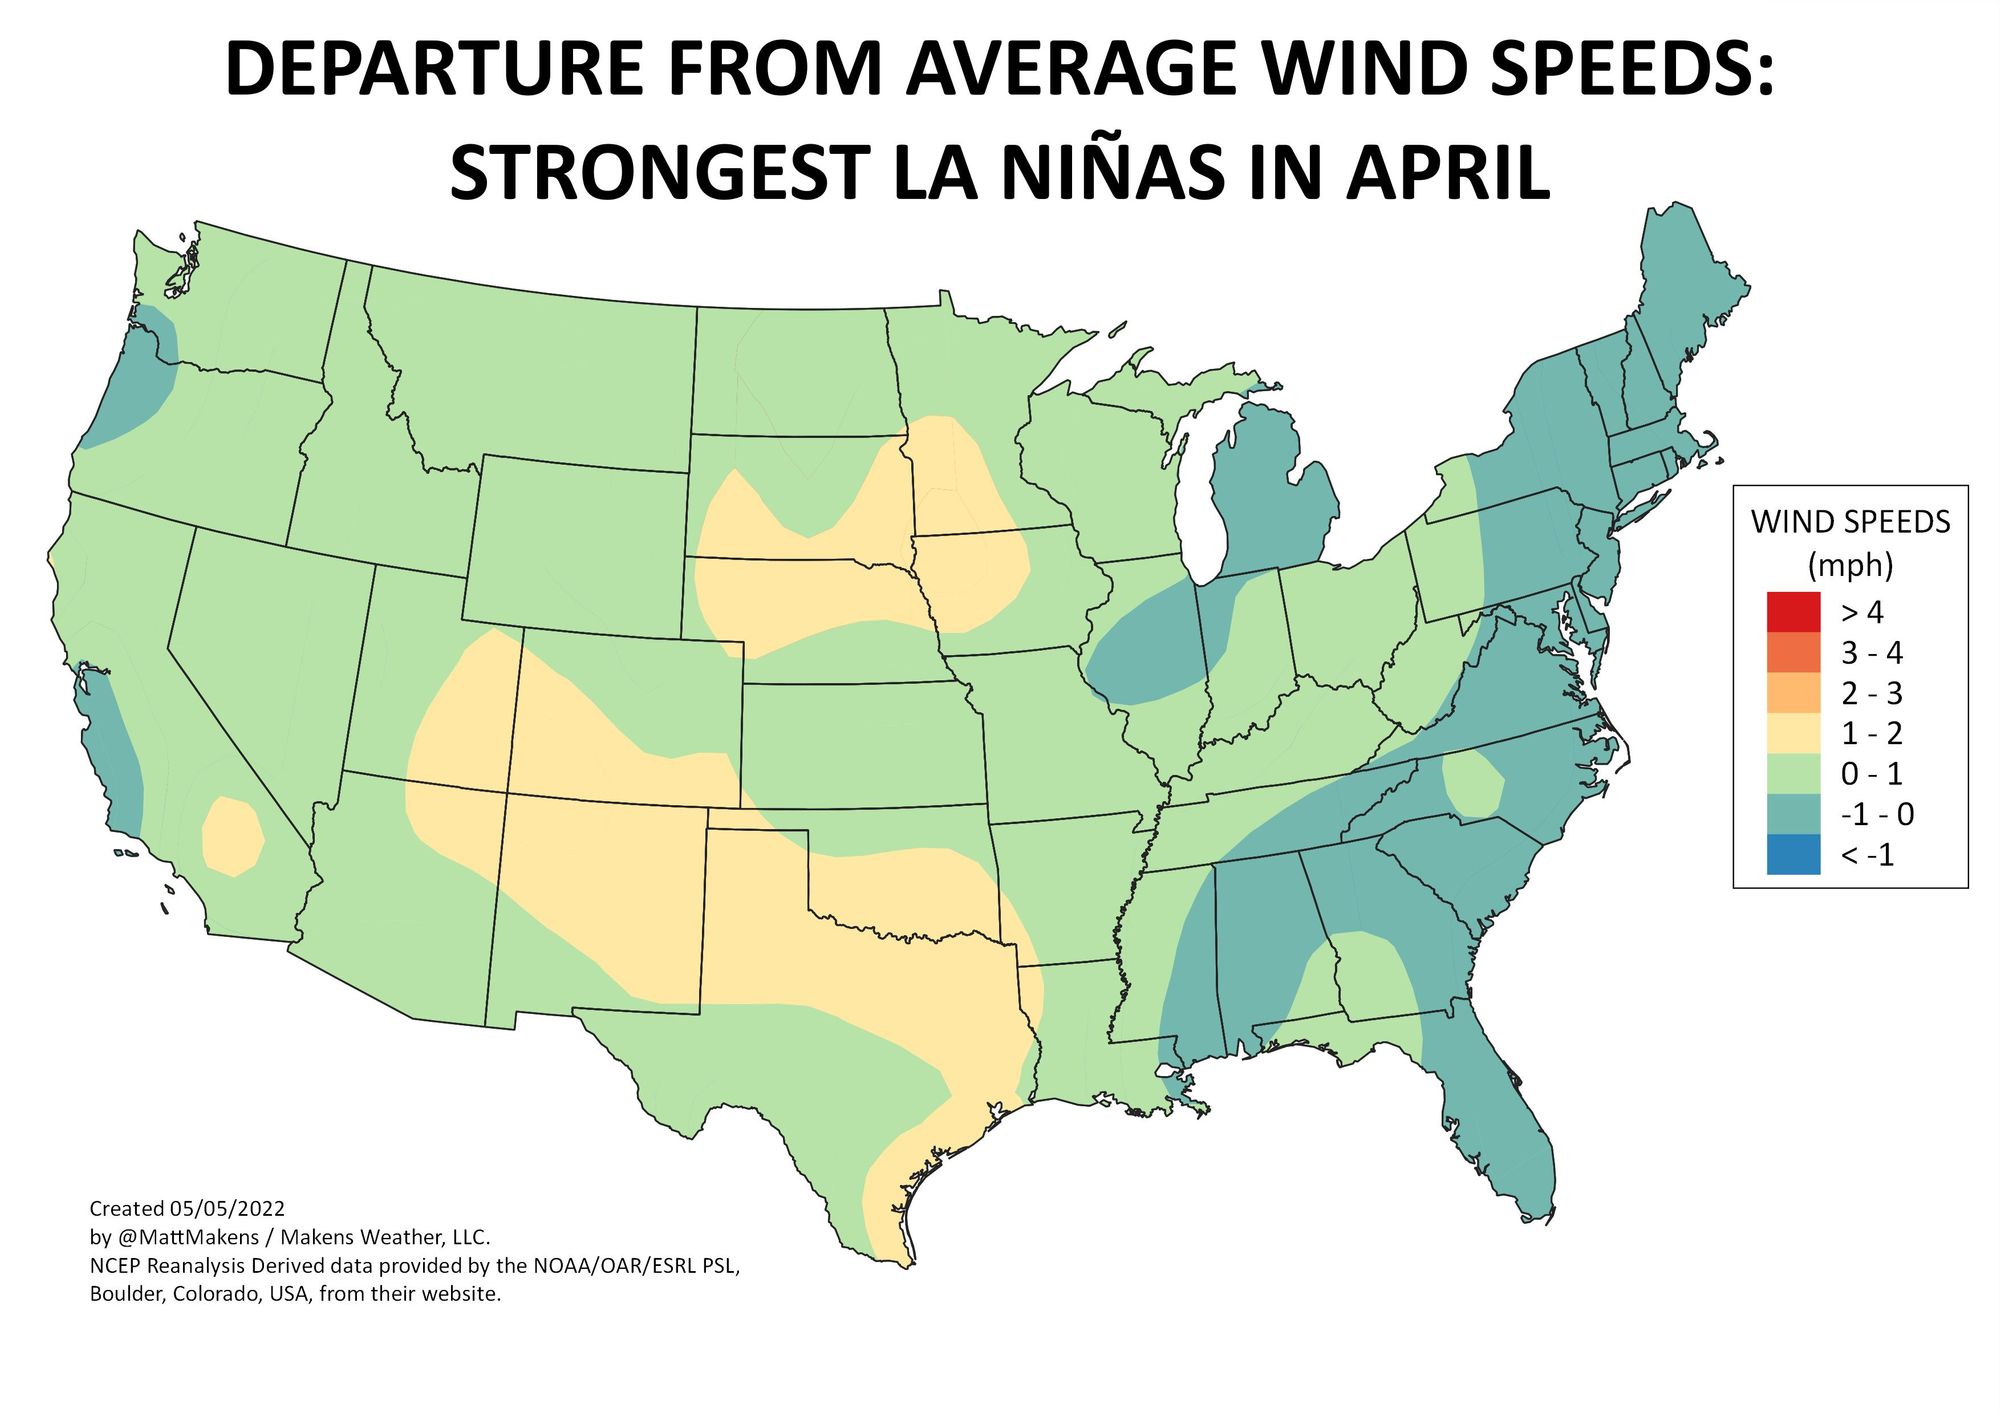
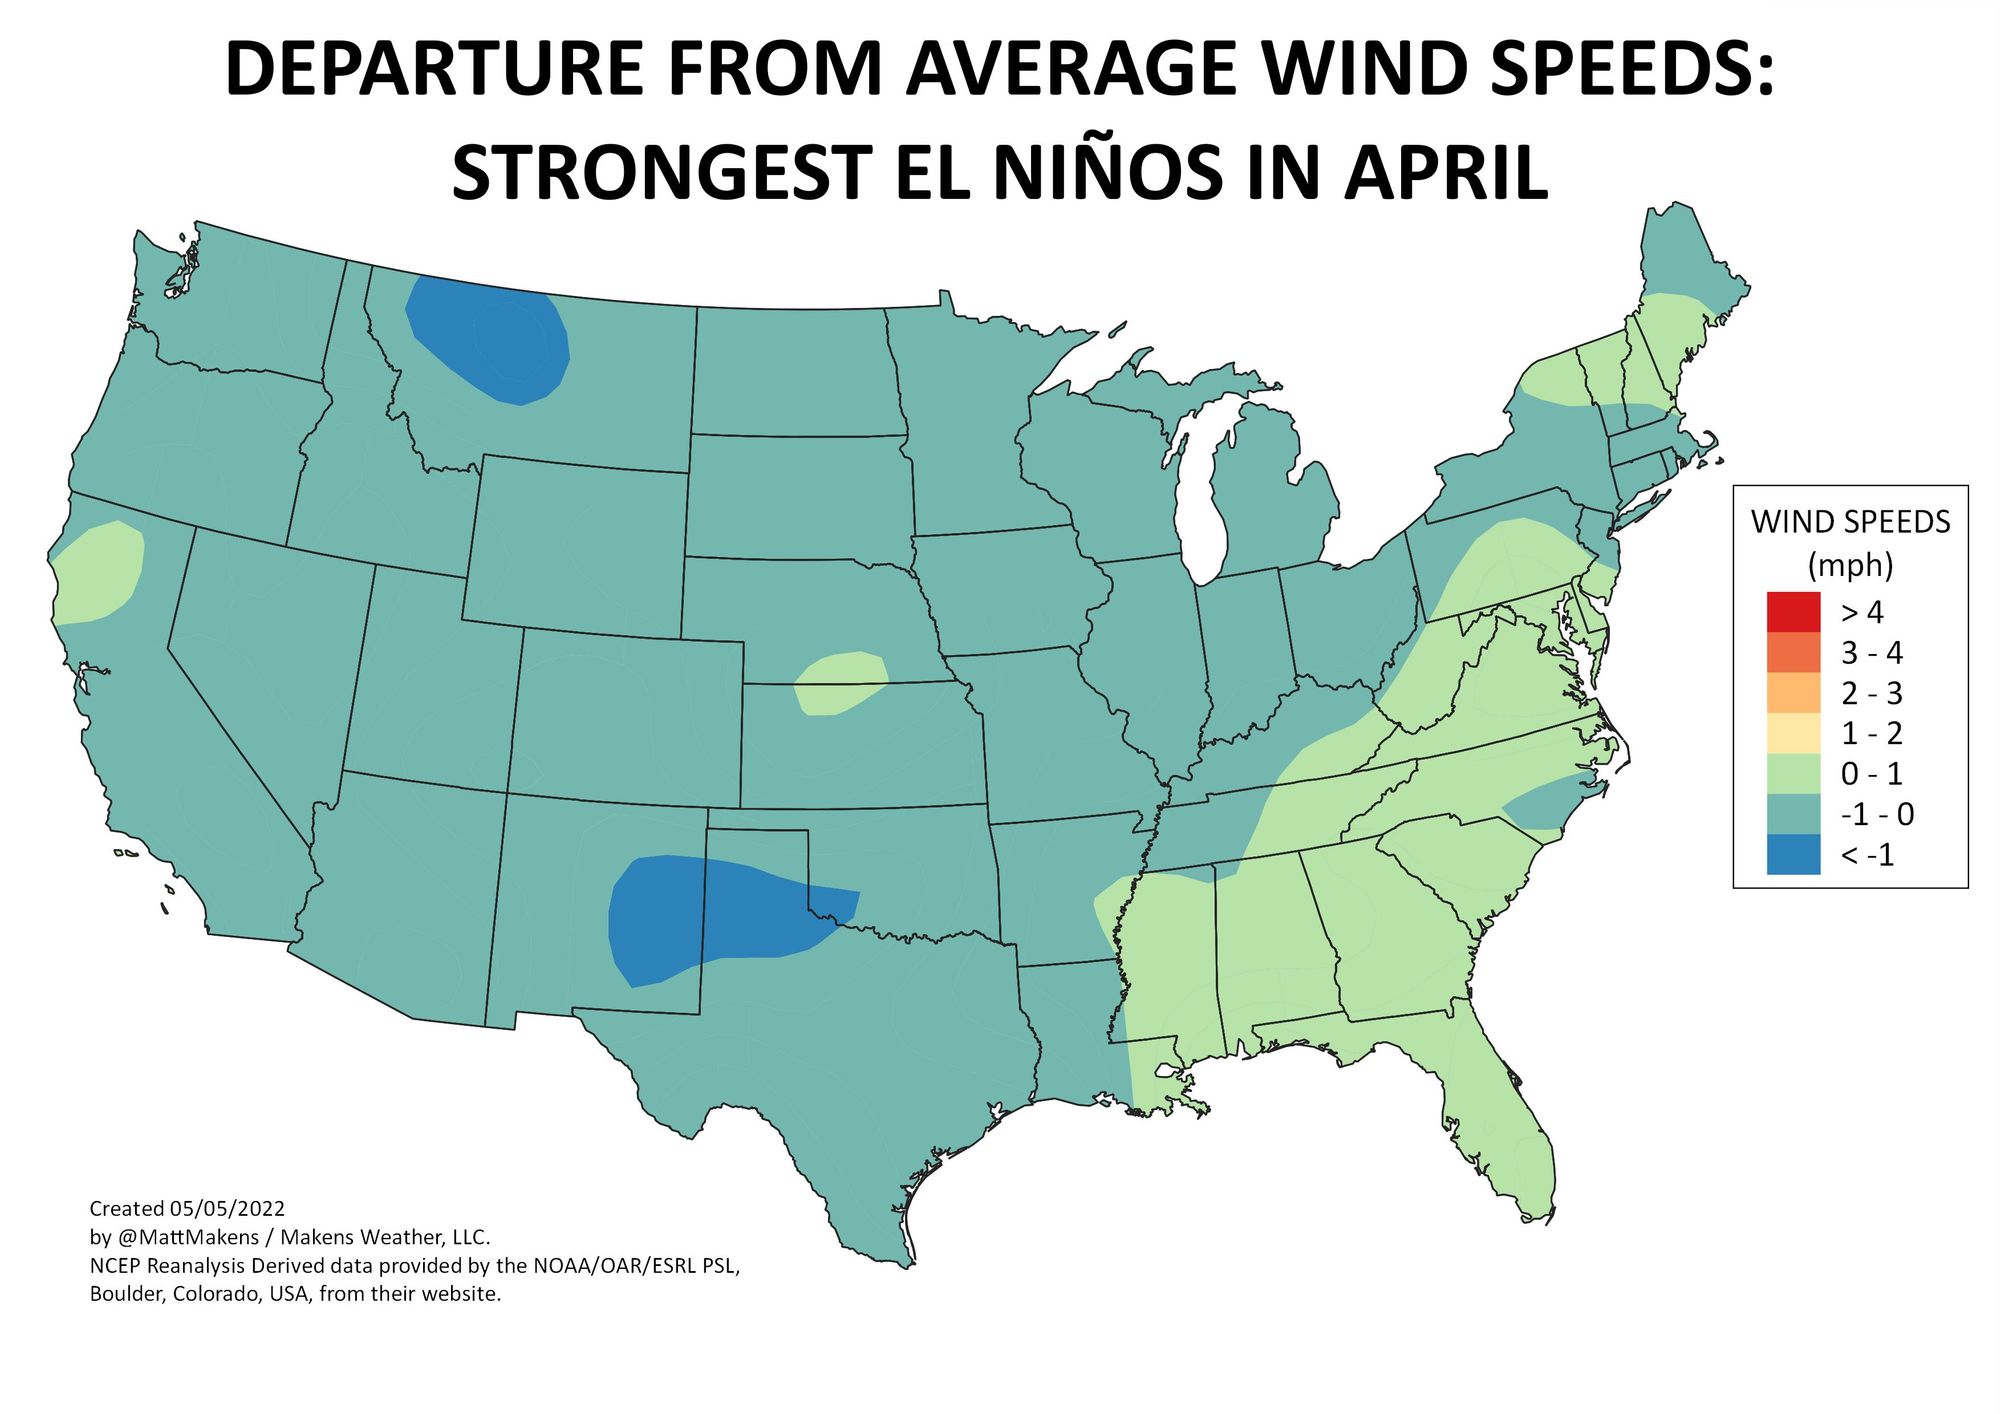
La Nina patterns are more likely to come with stronger surface wind. That's true as shown above across much of the country. This is particularly true for the Nation's midsection and less so along the coasts.
Let's bring it to a local level.
For the Front Range, I want to grab data from a single automated observation station with one of the longer periods of record. I've selected Centennial Airport (KAPA) as that option where the period of record begins in 1980. It's one of the longer periods and has a fairly nice daily data record.
I'll show you the data for the period of record first, and then we will focus on the past 20 years or so, as I'll explain in a moment. Let's see what the daily average wind speeds have been doing since 1981:
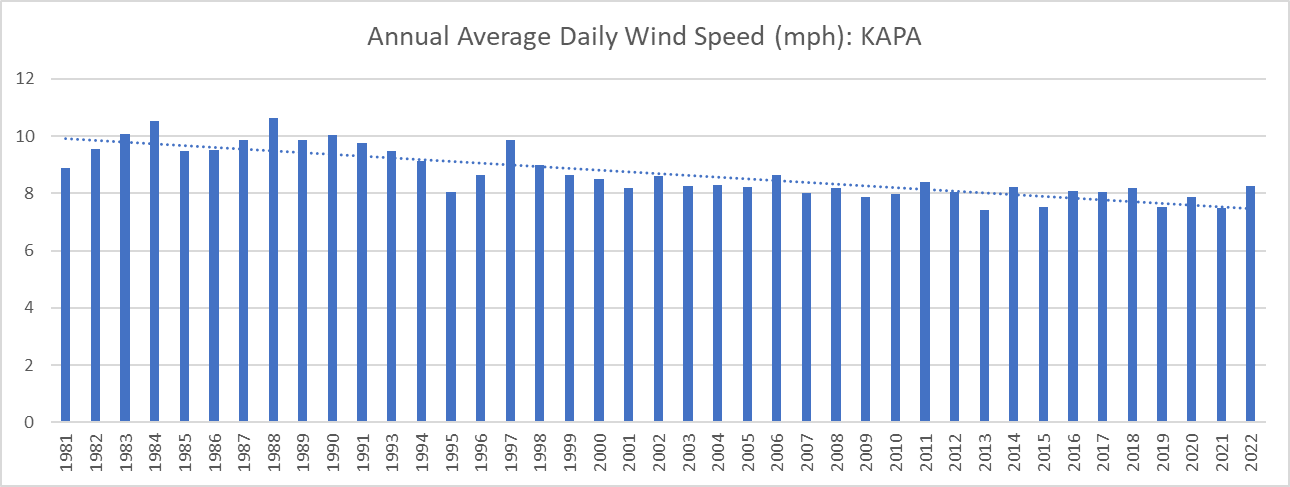
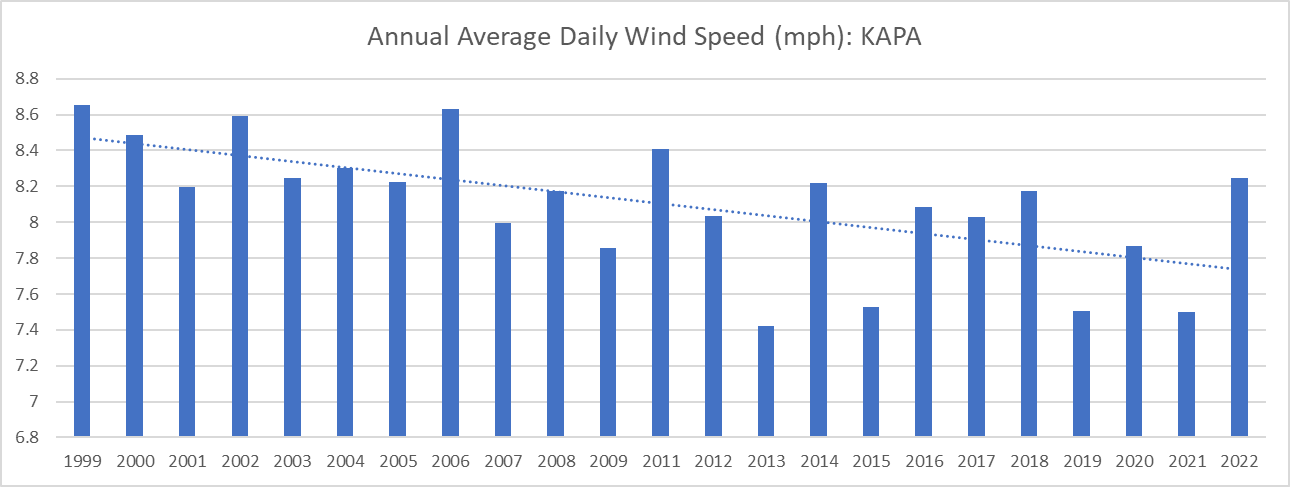
A decrease in annual average daily wind speeds since 1981.
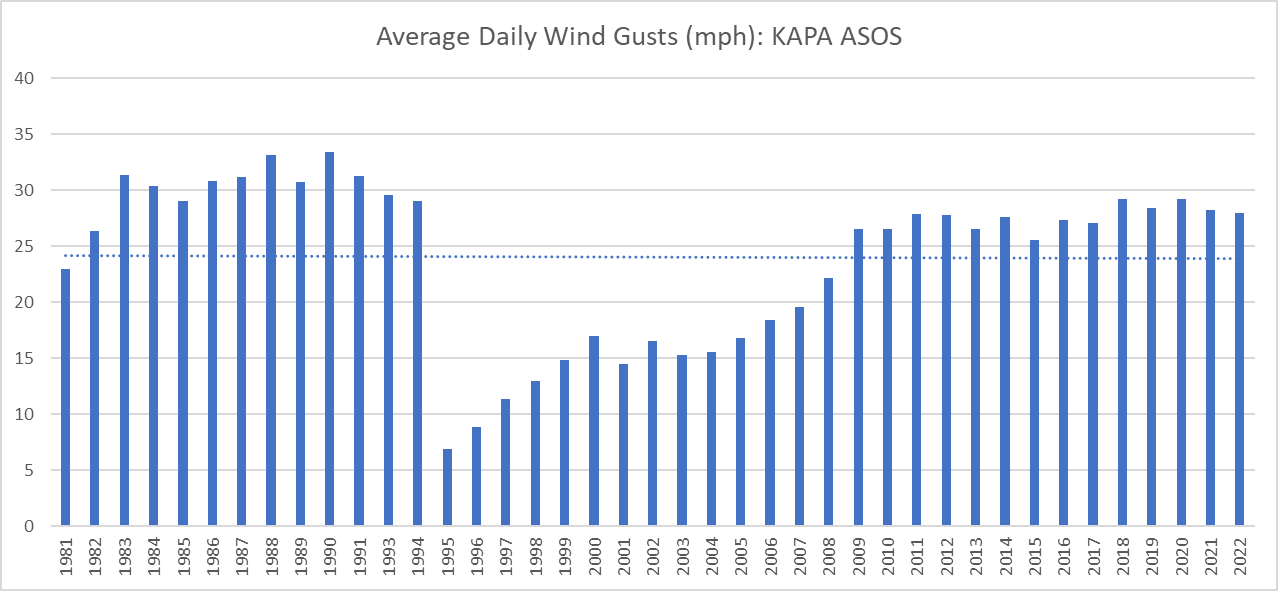
Near flatline in the average daily wind gust data.
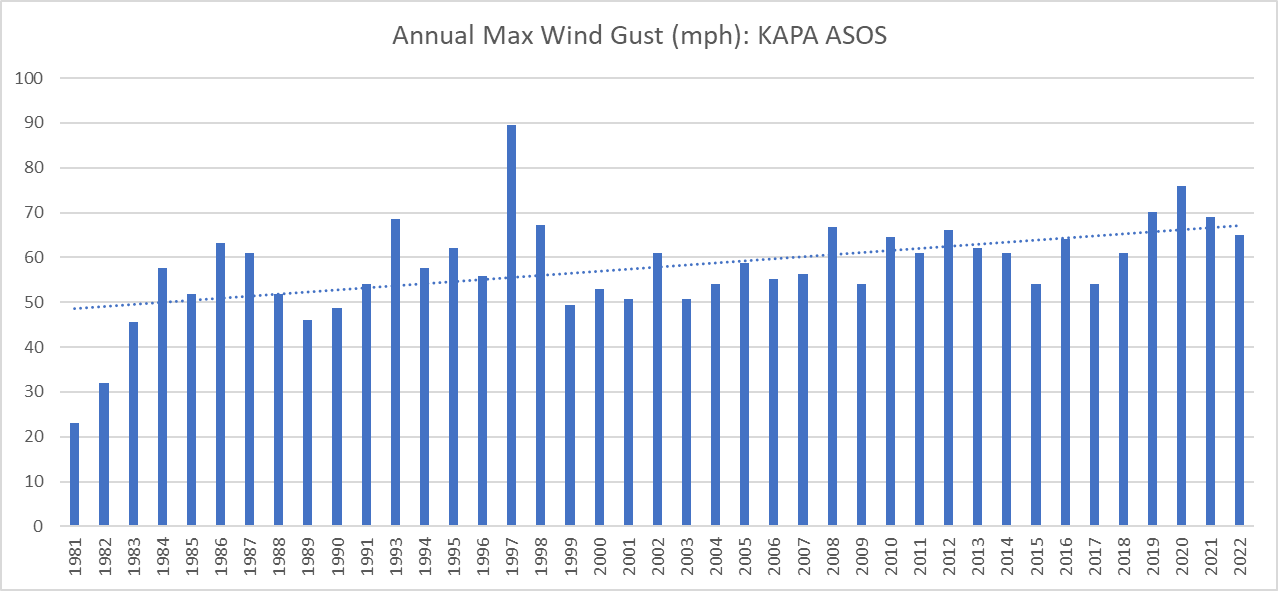
There's an increase in the strongest wind gust each year. Although, 1997 set the bar pretty high with a wind gust just shy of 90 mph.
And now the number of days each year when the wind gusts over 50mph. (Choosing 50mph which is the top 1% of days threshold.)
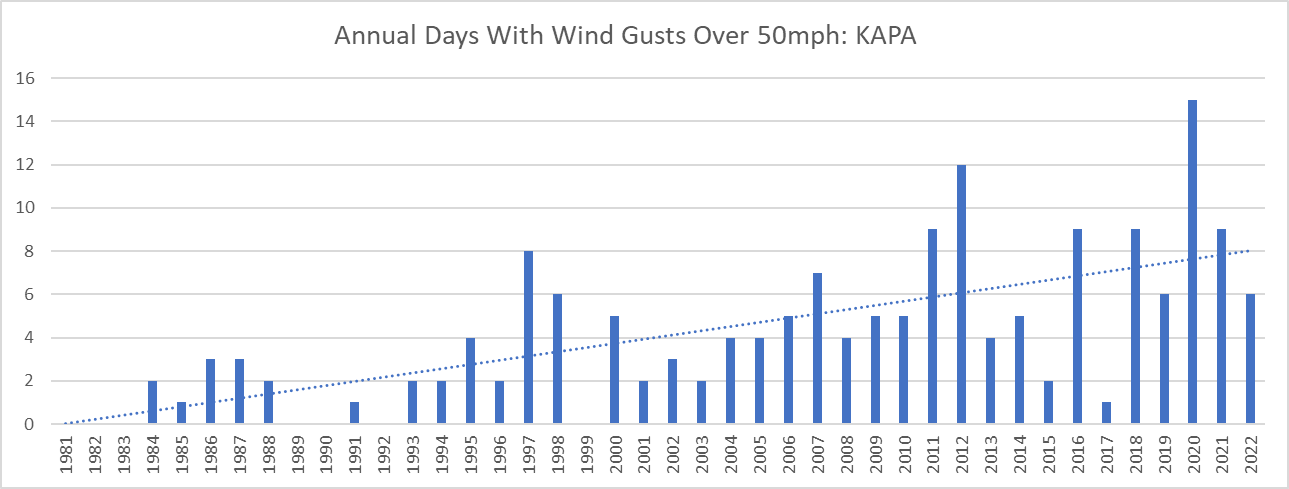
We see an increase in the number of days each year when we get hit with wind gusts over 50 mph.
When I process the entire period of record, I know there have been outages and station changes. There's certainly a red flag in the record as you look at the daily average wind gust chart above.
To see the most reliable period within the entire record, I referred to the ASOS update schedule from NOAA/FAA and see that a firmware/site update happened in mid-1998. So, let's see how things have progressed since 1999, the first full year following the update to the site.
Like above, the annual wind speed is decreasing.
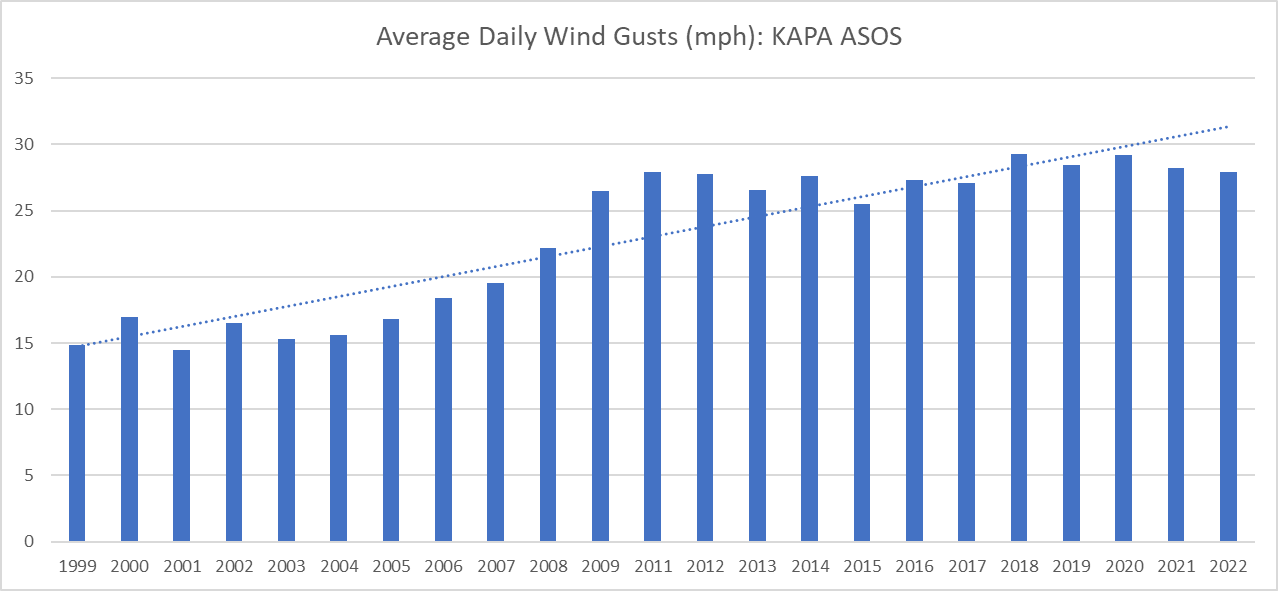
Also like above, the daily wind gusts are increasing speed.
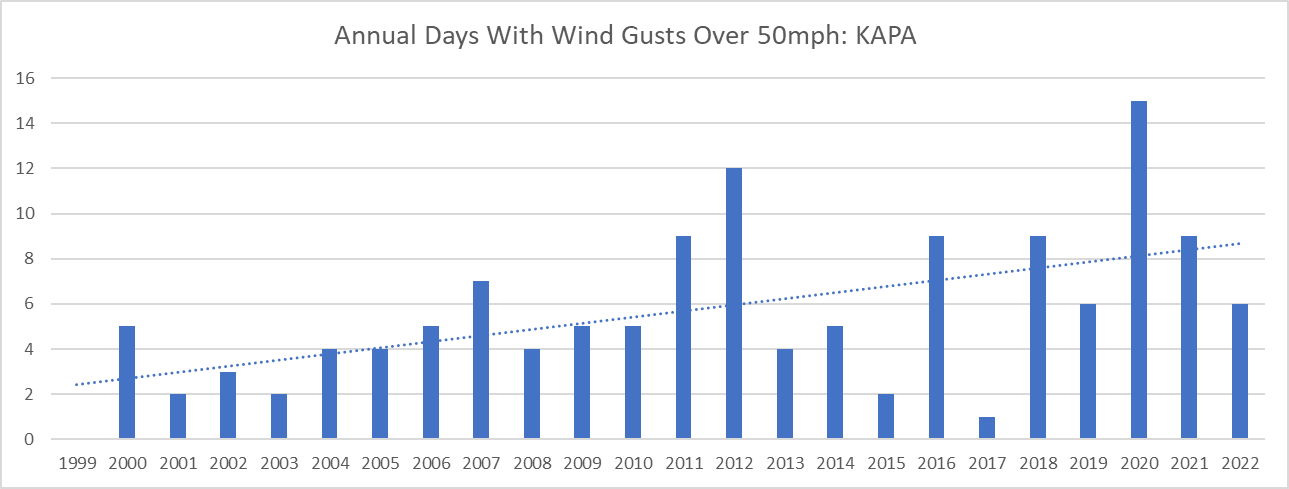
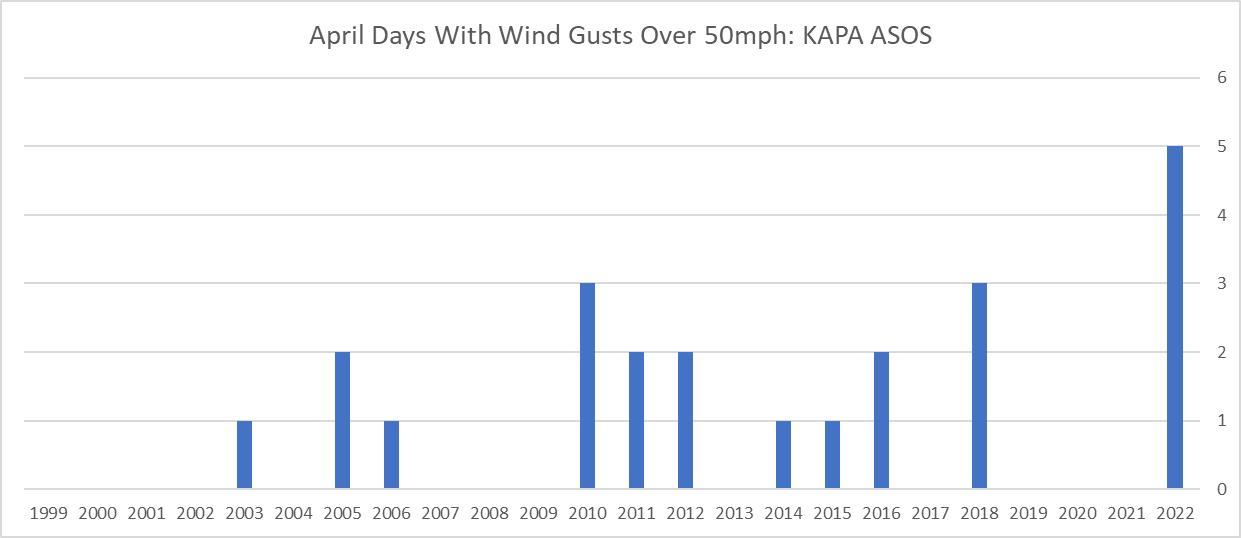
The number of days each year when the winds gust to 50 mph or stronger are on the increase. Even with the partial 2022 to date, we already have had more than our normal share of days with gusts over 50 mph.
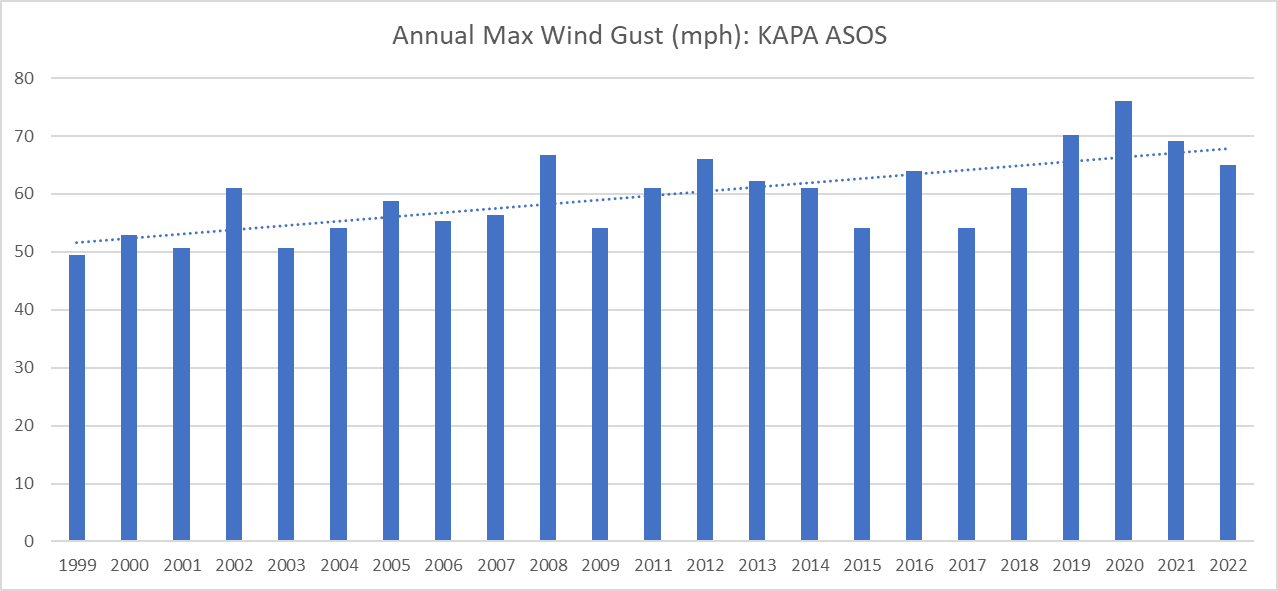
And, the strongest wind each year is trending stronger.
It's interesting to see the data for wind speeds indicate a slower daily average wind, yet the wind gusts have increased annually. (That's probably a discussion that would involve a site analysis of the nearby growth)
Since this post focused initially on April, let's see how April 2022 compared to years' past.
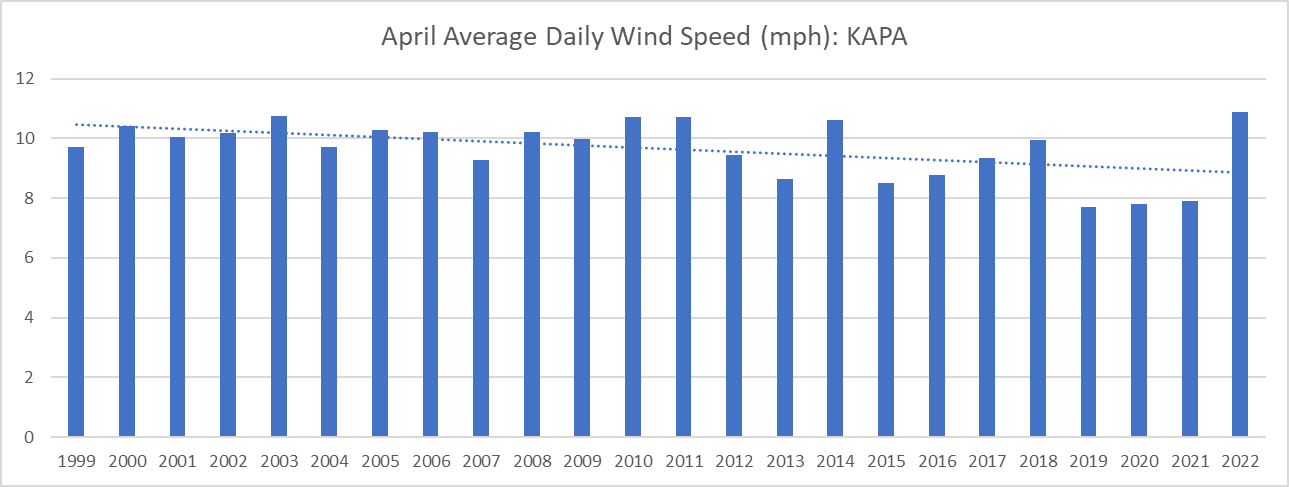
Wind speed, a max for April 2022.
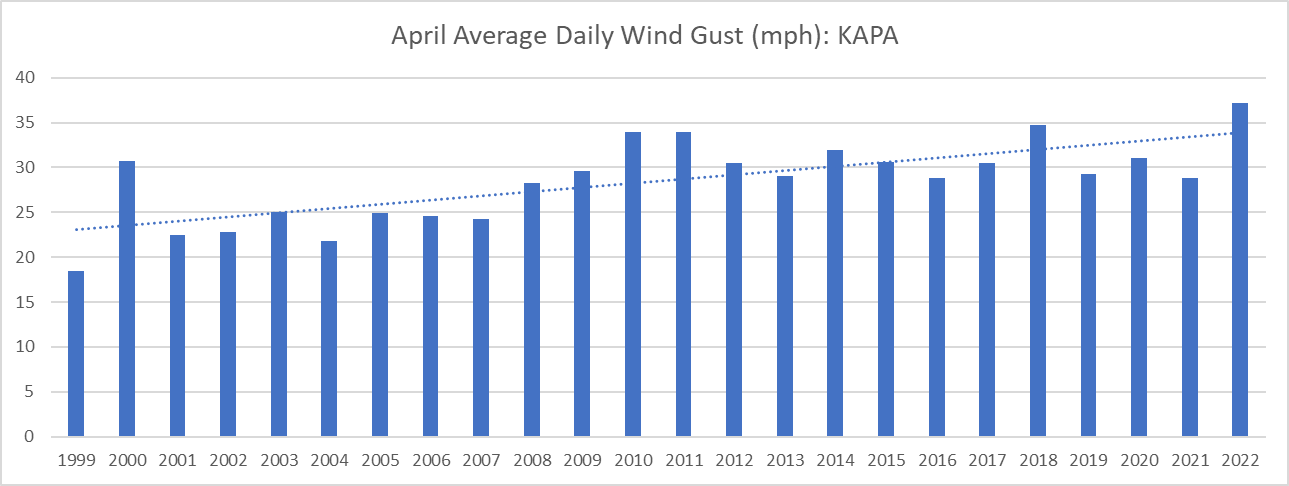
Average daily wind gusts, another max for April 2022.
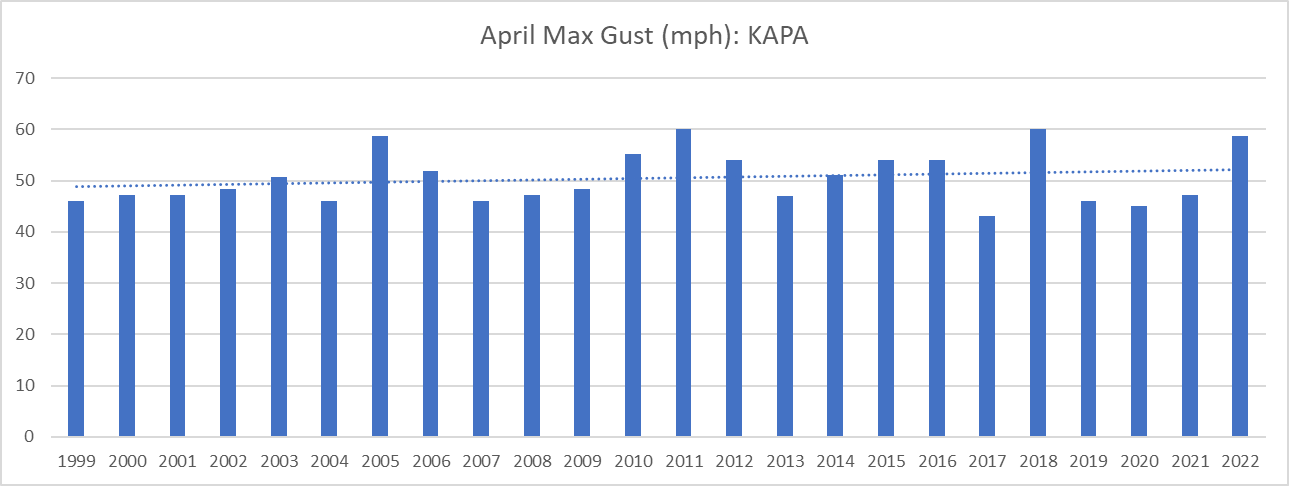
Not quite the strongest wind gust for any April, close though: April 2022 was 58.7 mph and 2018 was 60 mph.
Now, the number of days with wind gusts over 50 mph? Another win, easily so, for April 2022.
I hope this post gives you some perspective on the wind. It's safe to say we are seeing a greater frequency of wind events and stronger wind gusts, but it isn't technically safe to say it is windier than ever before... you might be talking to someone like me that will remind you the wind speed is actually trending slower. Well, for Centennial that is.
I'd compose a report with multiple sites listed, but this was meant as an example for the metro areas and not to be a time killer.