July La Niña and monsoon update

Plenty to sort through with this update, and based on what I'm seeing we have a lot riding on it too. First, let's look at what La Niña and rest of the global sea surface temperature anomalies have been doing, for the past 90 days.

- Despite La Niña being very much alive, it has been weakening a bit recently. Notice less blue shading along the equatorial Pacific.
- The colder than average water that was in the Gulf of Alaska and along the West Coast of the US has also been warming recently.
- There is still colder than average water that extends from the Baja to the southeast of Hawaii.
One might be excited to see some relaxation in the La Niña, but this is likely to be temporary. Currently, the Pacific Decadal Oscillation remains quite negative/cold, and is supportive of La Niña maintenance. (These two patterns typically go hand in hand)
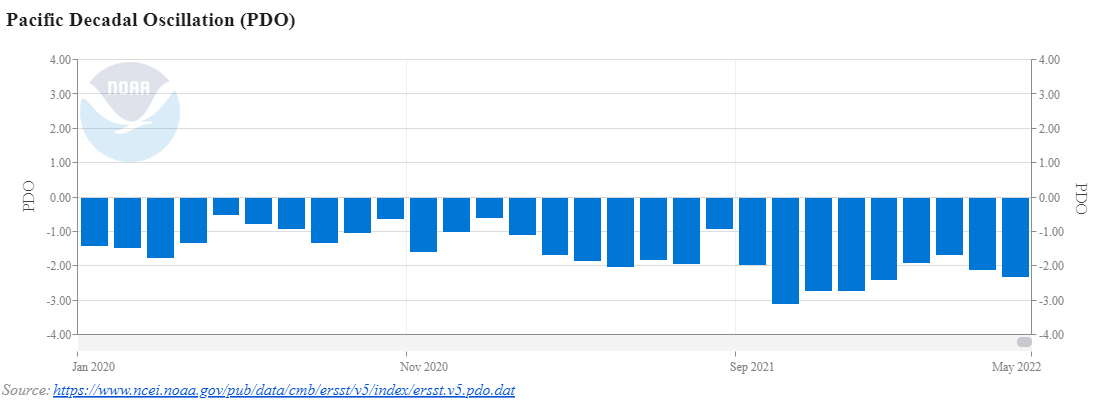
As the above graphic shows, the PDO has been quite negative since early 2020, and has shown no real signs of turn positive. Something else that is also pretty unusual, is how strong the trade winds (easterlies) have been along the equatorial Pacific. The graphic below shows that trend.
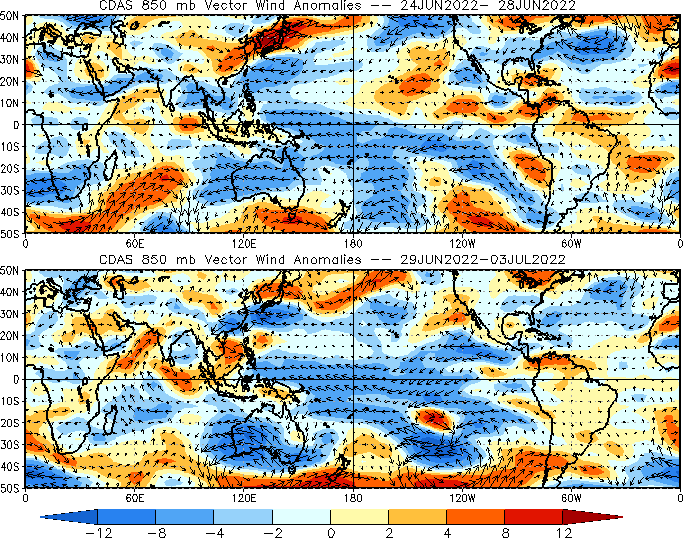
All of that blue shading along the equatorial Pacific indicates MUCH stronger than average trade winds, which maintains La Niña and eventually will act to strengthen it again. So, what do the models say about it?
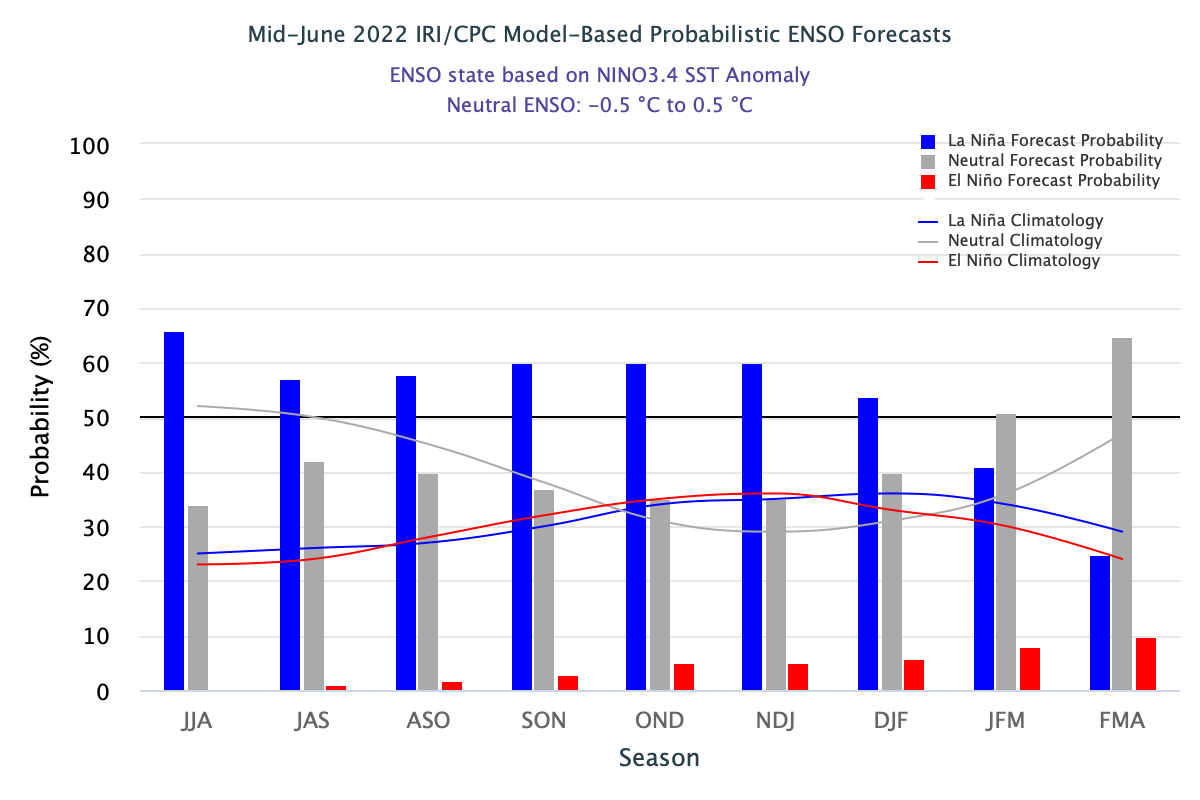
The mid-June ENSO probabilities forecast shows a 50% chance or greater of staying in a La Niña state through the early part of 2023. Model trends show it weakening thereafter. I think those probabilities are a bit low. La Niña looks like it's here to stay for awhile.
Monsoon Outlook
The graphic below pretty much shows what an ideal monsoon setup would look like for Colorado.
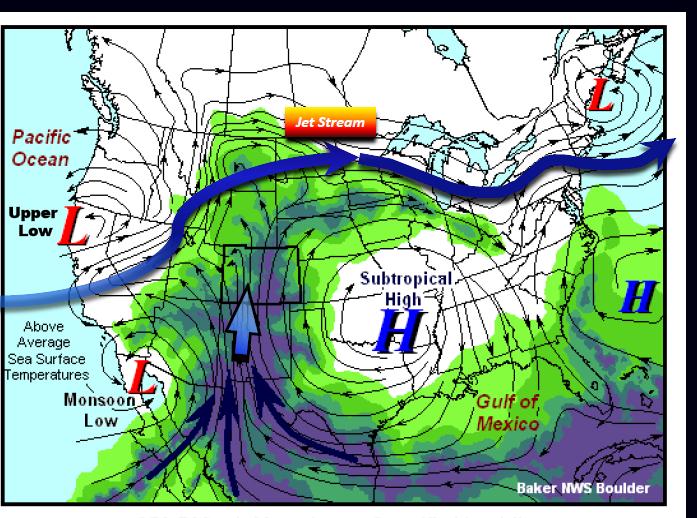
The subtropical H is located well to our southeast, and the clockwise circulation around that high allows good tropical moisture to move up from the south. That moisture serves as fuel for daily rounds of showers and storms. Many of which contain locally heavy rain.
The monsoon got an early start this year, and has delivered some serious rains to parts of Arizona and especially, New Mexico. The map below shows rainfall anomalies for the past 30 days:
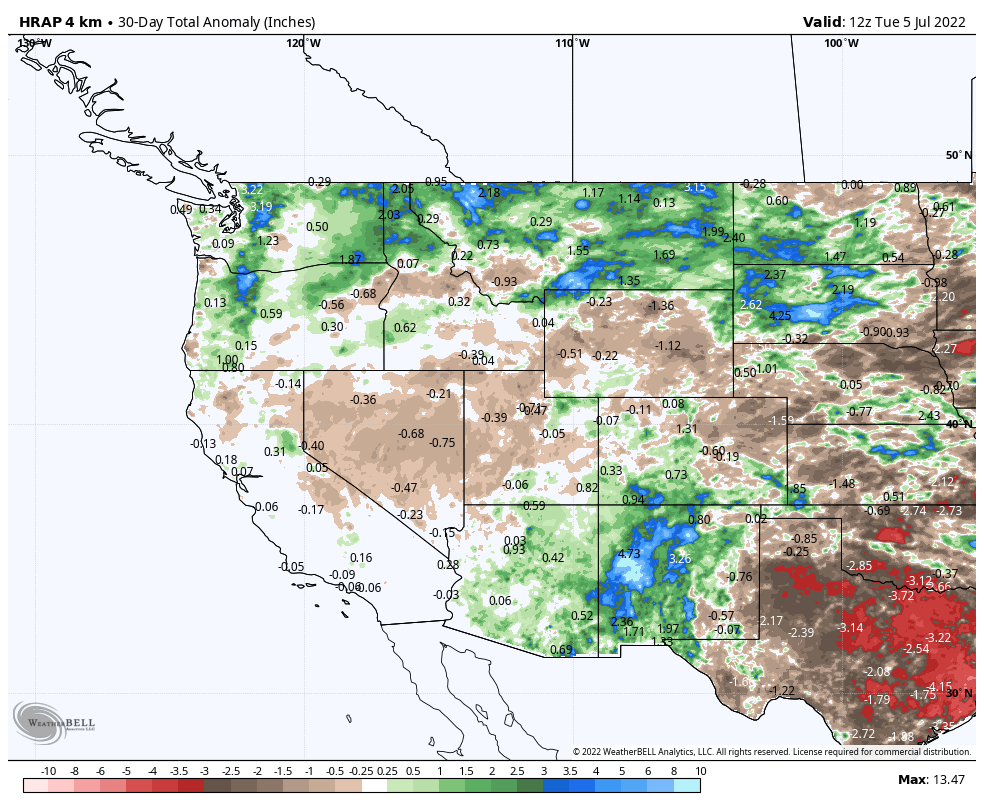
Some of that has impacted parts of Colorado, but has been favoring the southwest quarter of the state. Areas farther northeast have not been so lucky.
However, this has a lot to do with where the ridge of high pressure has been as of late. Here is where the H was located for the month of June.
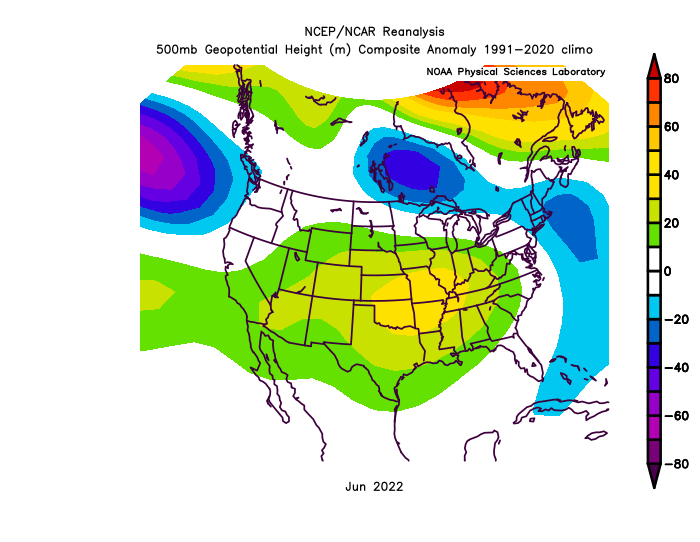
The yellow shading over Kansas, Oklahoma, Missouri, and Arkansas is where the center of the H has been located. That puts parts of the Four Corners states in a good spot for some early season monsoon action. So, where is it likely to sit for the next month or so? Here is the average forecast position for the next 30 days, courtesy of the EURO Weeklies.
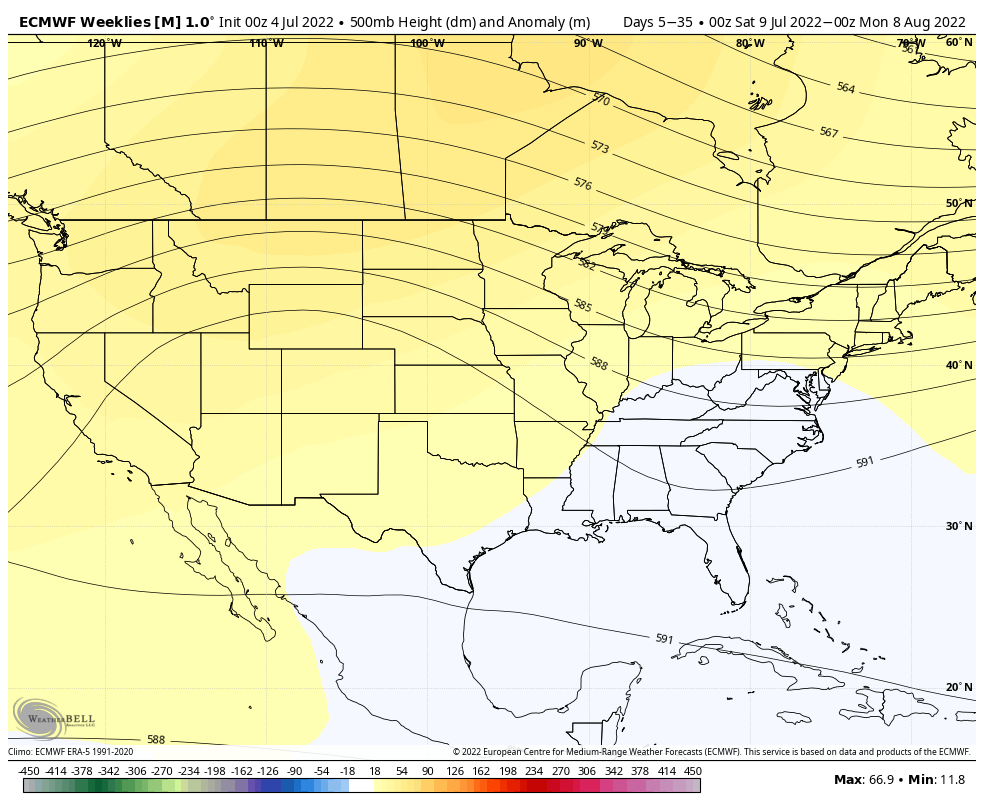
The height of the ridge axis resides across the Four Corners states northward into parts of the Northern Rockies. This is obviously in a different spot than it has been for the month of June. What does the model suggest for rainfall anomalies based on the position of the ridge?
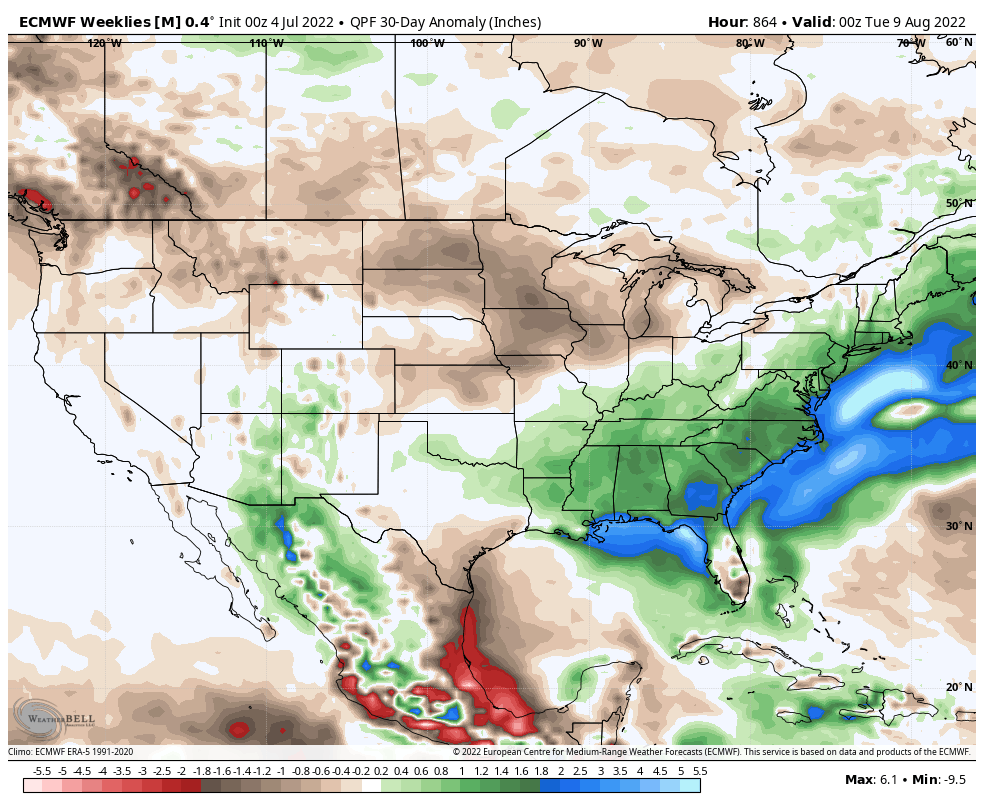
Average to wetter than average for Southwest Colorado and parts of Arizona / New Mexico. Areas farther east show up as average to drier than average.
What about the analog years and history? Based on the current La Niña and cold/negative PDO, here is the set of analog years and what happened with their July/August rainfall anomalies.
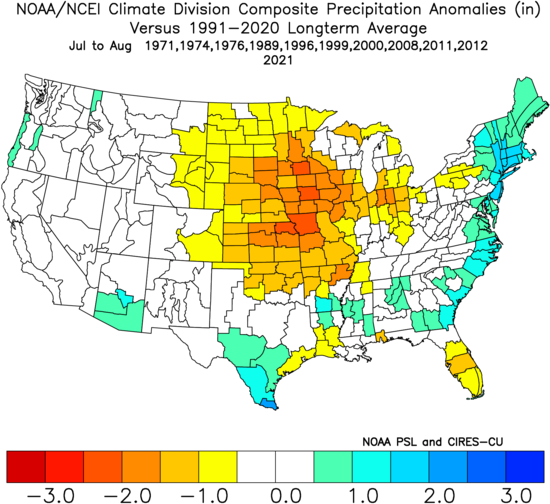
The yellow/orange/red indicates drier than average. The green/blue indicates wetter than average. White is average. While it isn't a perfect roadmap, both the analog years (history) and the EURO Weeklies are in pretty good agreement with the pattern. While I am not completely sold on how dry it could be in the Midwest, I am sold on it remaining average to wetter average for Arizona, New Mexico, Southwest Colorado, and possibly parts of Texas. The wildcard for Texas is what happens with tropical storms in the Gulf of Mexico.
How does the latest EURO Seasonal Model stack up? Let's take a look...
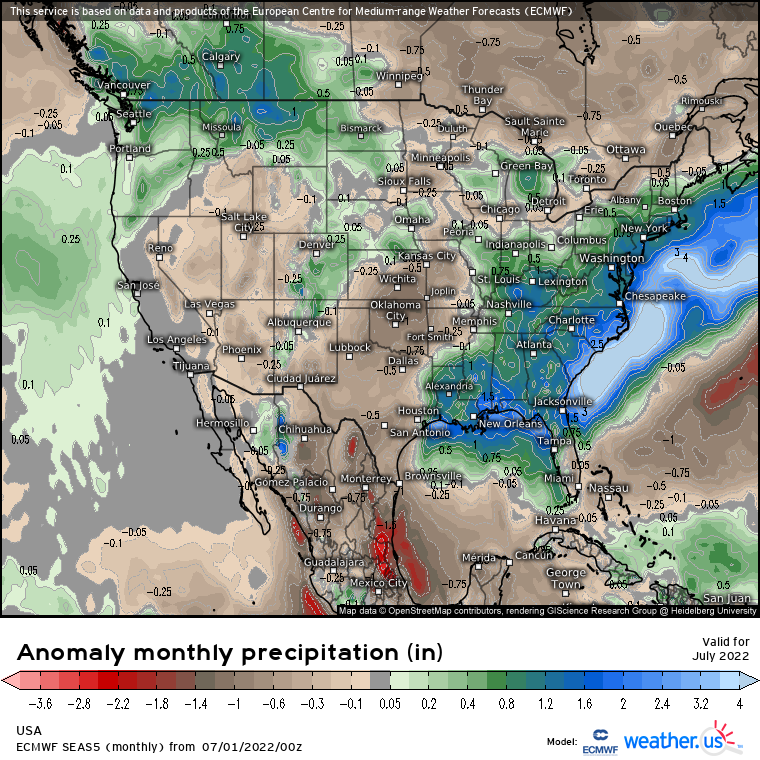
EURO Seasonal Model July Rainfall Forecast
EURO Seasonal Model August Rainfall Forecast
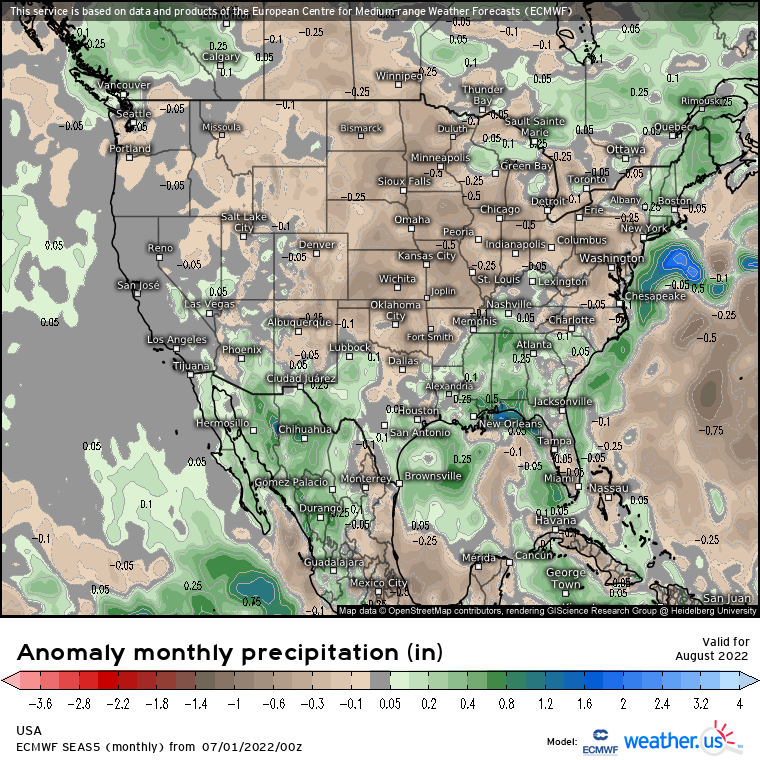
If you buy what the EURO Seasonal Model is showing, the rest of July would be pretty good for eastern Colorado specifically, before turning off dry again for August. In fact, the model suggests that the whole monsoon pretty much ends in pretty weak fashion after July.
While I don't think the monsoon will be a complete failure as it has been for the past two years, I do think some areas are going to have to get lucky. I think Southwest Colorado likely has the best chance to see the most rain. As of right now, I think those meaningful rains will be much more spotty along the Front Range and across the Eastern Plains. It is concerning that the models and history both suggest it turning off drier than average for August. August is the wettest month of the year for many areas of Colorado and missing out on those August rains would hurt. With that in mind, I am not optimistic about what lies beyond August either.
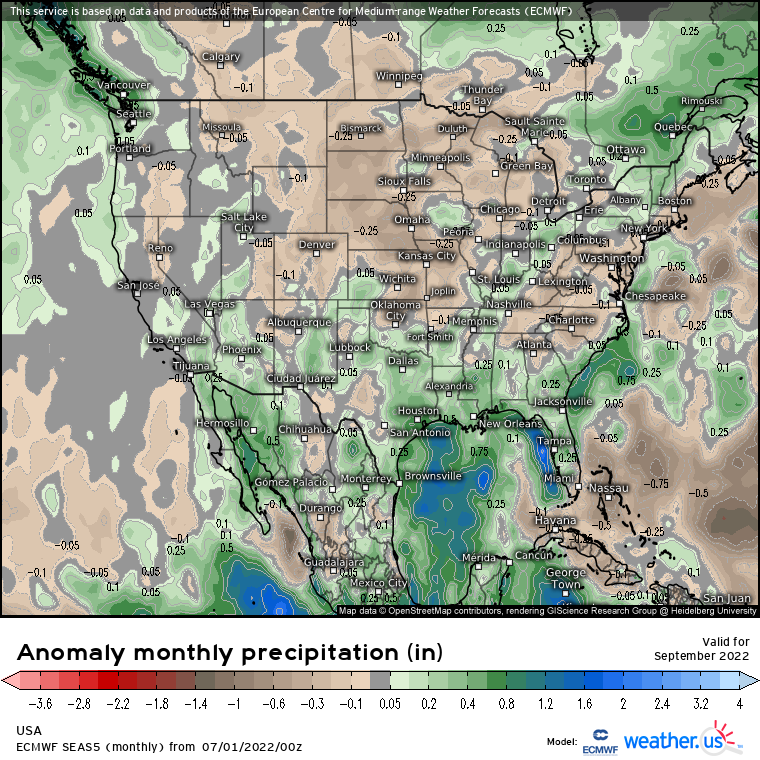
EURO Seasonal Model September Precipitation Forecast
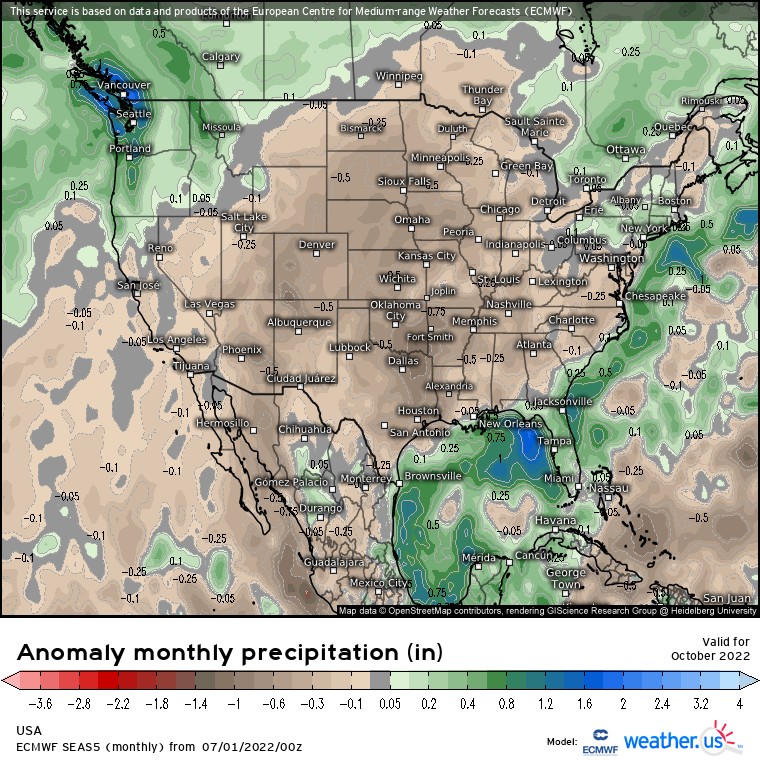
EURO Seasonal Model October Precipitation Forecast
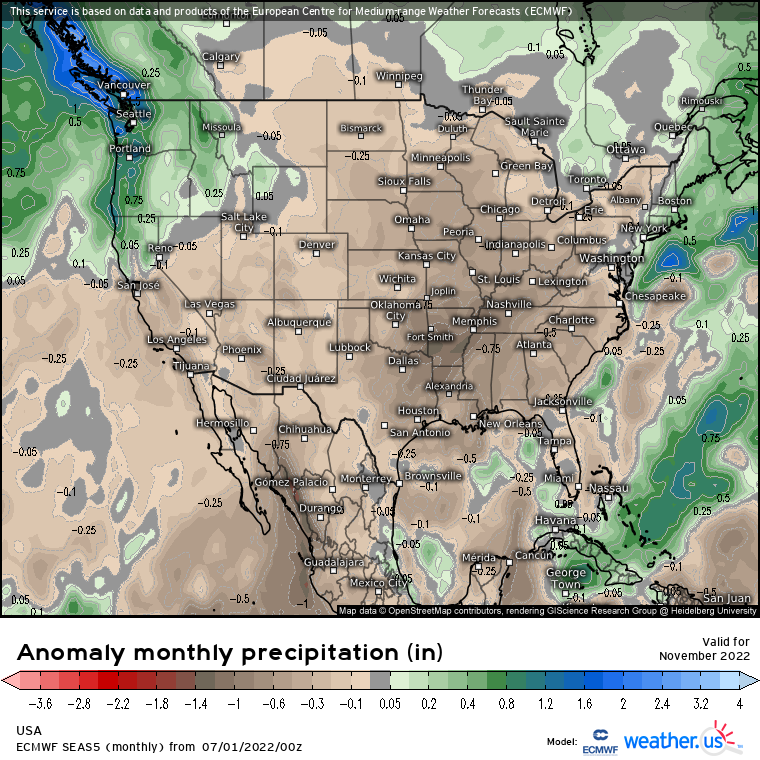
EURO Seasonal Model November Precipitation Forecast
I know the news is less than ideal. Could the forecast elements at play be incorrect with the dry forecast? Sure, anything is possible. However, I believe that to legitimately have a chance of breaking this cycle of drought, we have to change the phase of the PDO. Negative/cold PDO is usually never a good thing for us. And while a warm/positive PDO isn't necessarily a slam dunk for wetter times, it is certainly better than the phase we are dealing with now. Unfortunately, I do not see the PDO changing phase for awhile certainly not in a meaningful way before spring of 2023.