What a Strengthening MJO Could Mean for Colorado and the Southwest this May

We talk about a variety of atmospheric oscillations that govern our weather, but haven't yet talked about one of the most important ones: The Madden-Julian Oscillation or MJO.
Simply put, the MJO deals with thunderstorm development (convection) in the tropics over the western Pacific Ocean and Indian Ocean. It usually cycles about every 30 to 60 days, is most active during weak La Niña or La Nada (neither El Niño or La Niña) events, or during the transition to an El Niño. However, it is usually very INACTIVE during an El Niño event.
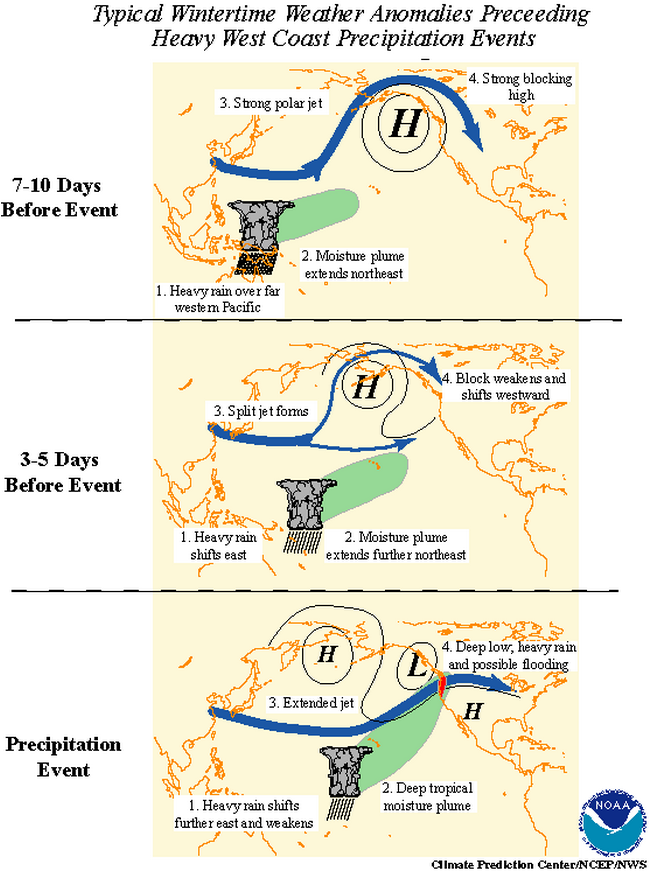
Below shows two graphics of how the MJO works, how it moves, and the usual impact once it propagates into the Eastern Pacific Ocean.

Usually, when the MJO is strong and active, our weather is pretty active. Has the MJO been strong recently? Lets check it out. The chart below tracks the MJO back to 2007. The red spikes above the zero line indicate strong MJO activity. The spikes below the zero line indicate very anemic MJO activity.
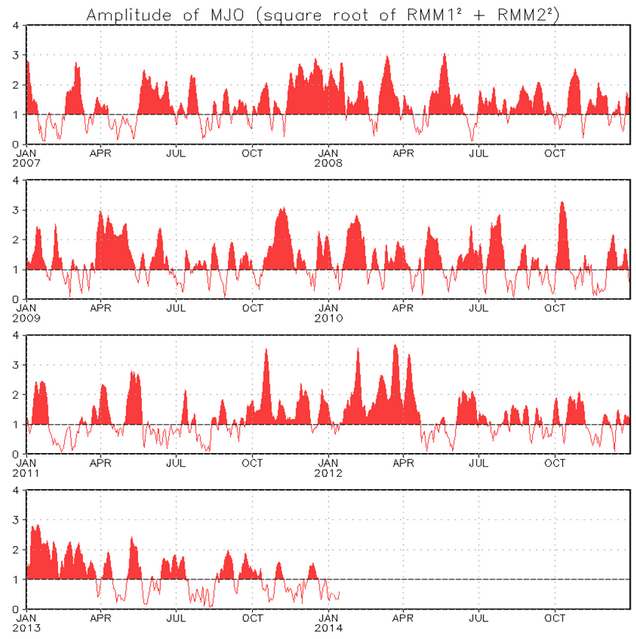
Notice that since the fall, the MJO has basically been inactive. That helps explain why many areas from California through the southwestern High Plains are suffering from drought, which have resulted from an inactive weather pattern for that region. Bottom line, when the MJO is not active, our storm track struggles to be active in the southwest part of the United States. In fact, one can draw a direct correlation with an inactive MJO and long periods of dry weather in the southwest part of the US.
Given how impactful the MJO can be on our immediate weather, it is important to track the strength of the cycle and how it is moving. When an MJO event moves into specific regions around the world, it has different impacts in temperature and precipitation. The chart below is called a Wheeler Diagram. It shows how strong the MJO is (farther away from center, the stronger it is) and what region (Western Pacific, Indian Ocean, etc) it is moving through across the globe.
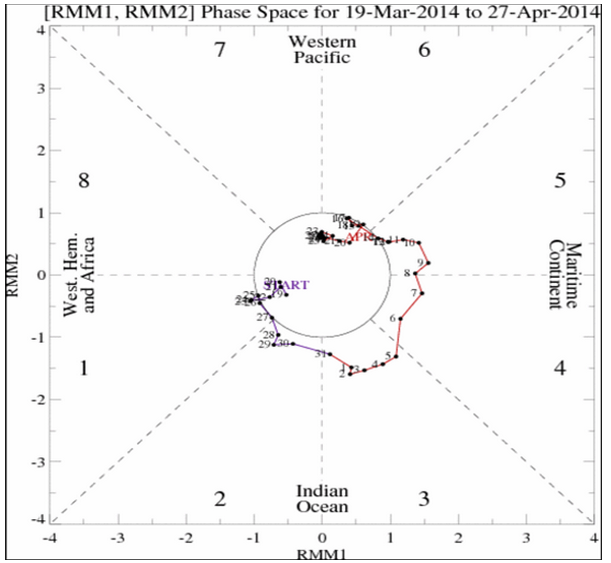
The purple line that starts in the circle is where this cycle of the MJO started in mid to late March. This cycle is not that strong (not too far away from the center circle) and is for all intents and purposes not having a huge influence. However, take a look at what the ECMWF is forecasting as we head into May:
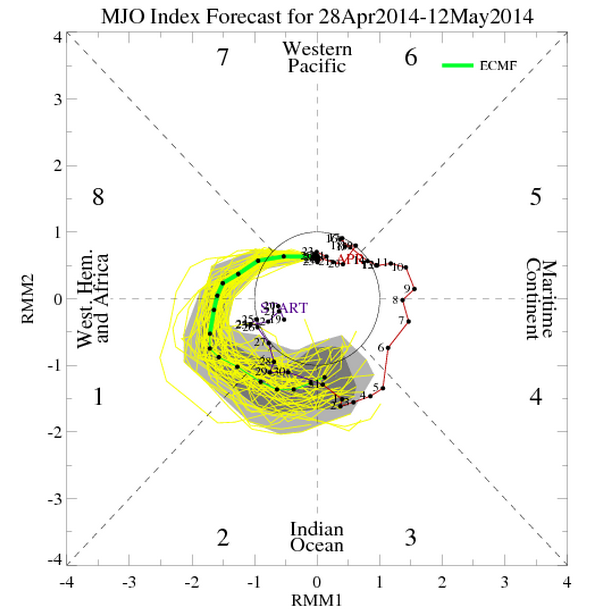
Notice that the ECMWF actually strengthens the MJO and takes it through region 8 and 1 as a pretty strong signal. BIG DEAL. . . what does that mean for us? The set of graphics below tells us in general what weather occurs when the MJO is in a specific region.
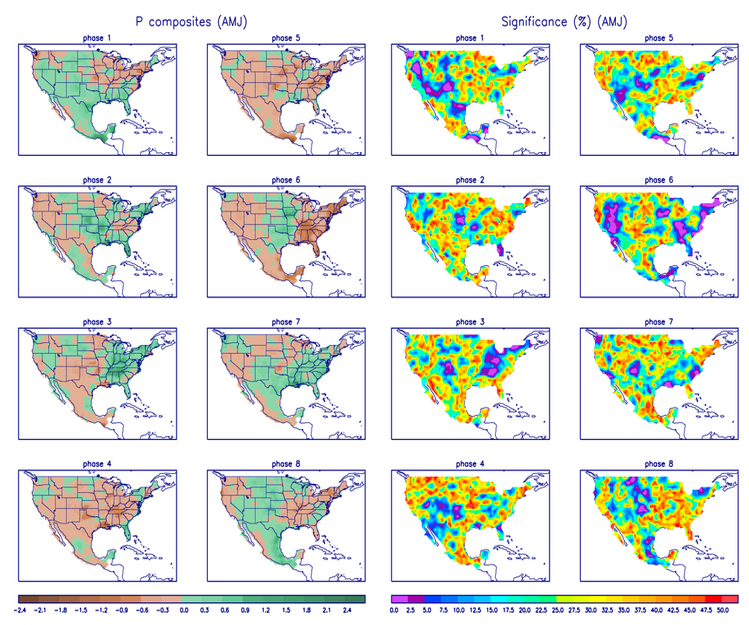
The above set of maps shows the weather pattern GENERALLY expected when the MJO is in each phase/region. The left side deals with precipitation anomalies and the right side with temperature anomalies. Since the ECMWF model is forecasting the MJO to remain in phase/region 1 & 8 for a while, historical analysis indicates we may stay slightly wetter than normal heading into May. Notice the green shading over Colorado during phase 1 and 8.
Temperature-wise, you may also notice the "blue and purple" shading over Colorado when the MJO is in region 1 and 8. Thus, the composite precipitation and temperature analysis tells us that if the MJO is in region 1 & 8, out chances for being wetter and colder than normal are increased. That is IF the MJO behaves as expected. . .
We are rapidly transitioning toward an El Nino episode, and it is usually during this type of transition that the MJO gets active. Could this be a sign of the MJO starting to get its act together and have a meaningful impact on our spring? Possibly, as longer range models still keep our weather pattern pretty active through May.
To keep us reverting back to widespread drought as a state, we need more than just one month of an active MJO. Unfortunately, with the El Niño trying to come on strong, I think our window is limited in terms of MJO activity. I hope we make the most of it.