6 Tools to Visualize the Northeast Blizzard That Didn't Exist Last Time Around

It's been nearly five years since 20.9" of snow fell in New York City, landing it at #4 on the top snowfalls on record for the city. Over these five years a lot has changed in how we ingest weather forecasts and information, how this information is disseminated, and of course in how social media carries the weighty load of all things good and bad when a storm comes a-callin'.
WeatherBell Analytics wasn't a thing
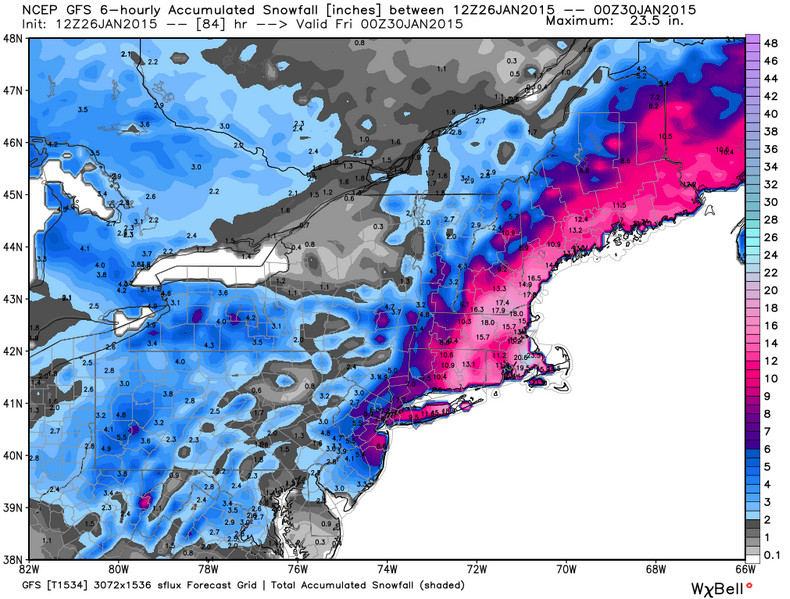
WeatherBell's splash in the forecasting maps world is relatively recent. The startup didn't really come onto the scene until 2011, and has since helped reshape how both amateur and professional meteorologists discuss and share weather data with their audiences.
While WeatherBell's services are far-reaching, when blizzards threaten the northeast U.S. you can bet on seeing Ryan Maue's maps flooding Twitter streams and the mainstream media alike.
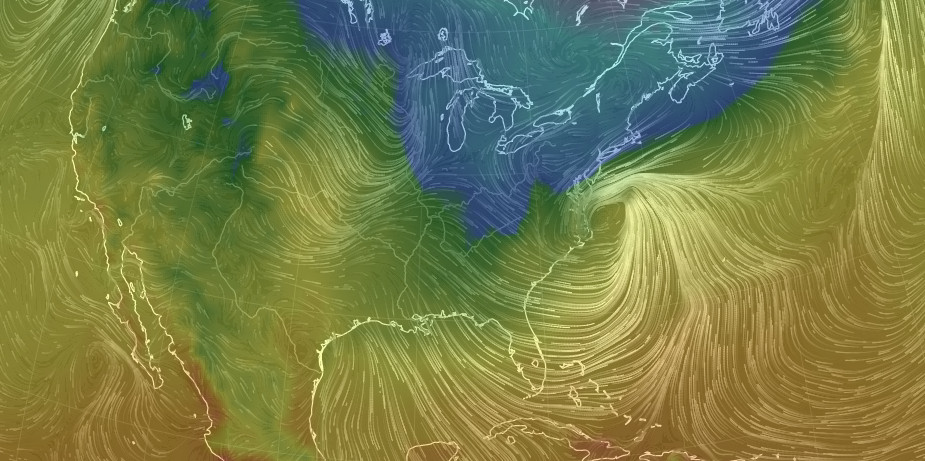
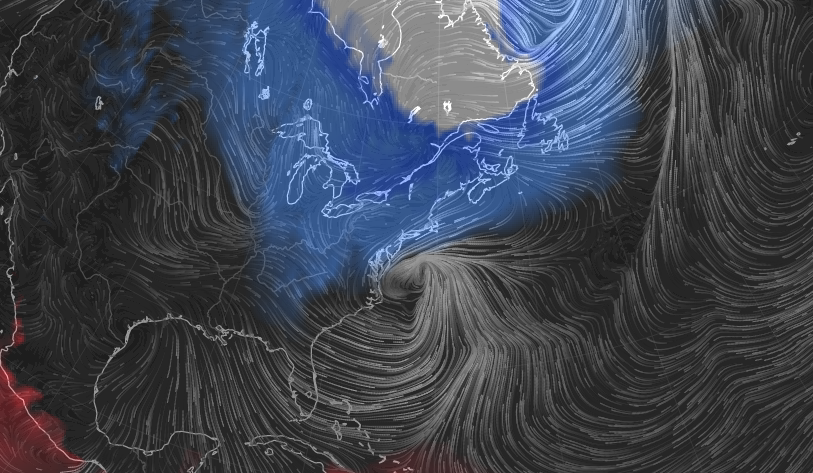
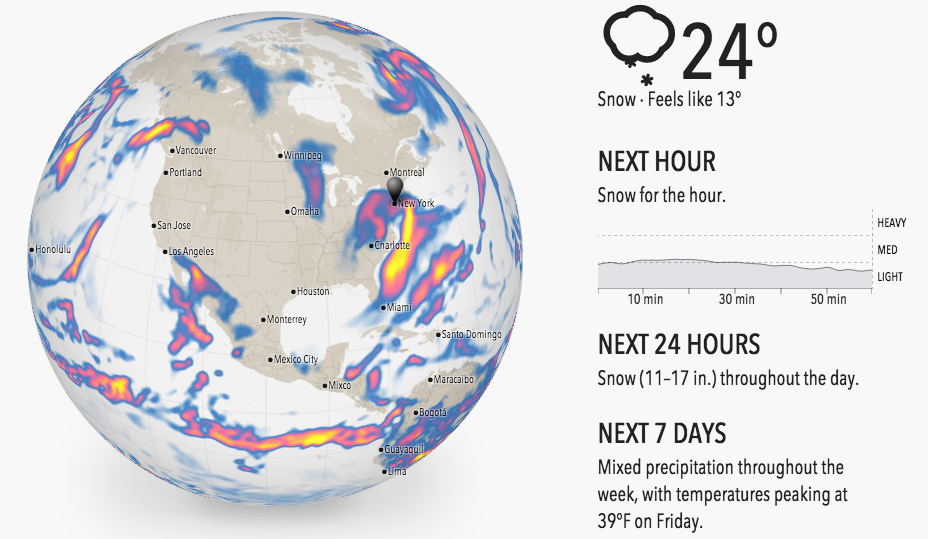
Earth!
Okay, earth was certainly around five years ago, but Earth the visualization by Cameron Beccario was not.
FreshyMap
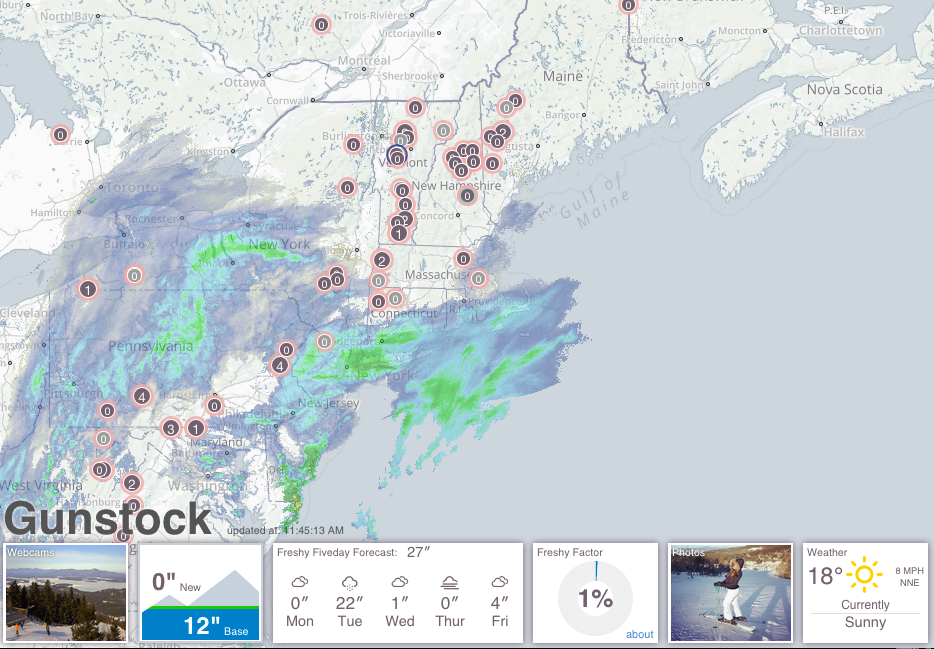
This one's really for the powderhounds in the group, but FreshyMap offers numerous was to visualize storm and snow impact, from real-time wind, to current radar, 5 day snowfall forecasts, and of course, the all important FreshyFactor. With 27" in the forecast for Gunstock this week, all is good.
Forecast.io
Leaving the issue of forecast accuracy and weather Apps for another day, Forecast.io has jumped to the forefront in weather APIs and has changed expectations in how automated forecasts should be delivered and visualized. Forecast.io now serves over 8 million API requests daily.
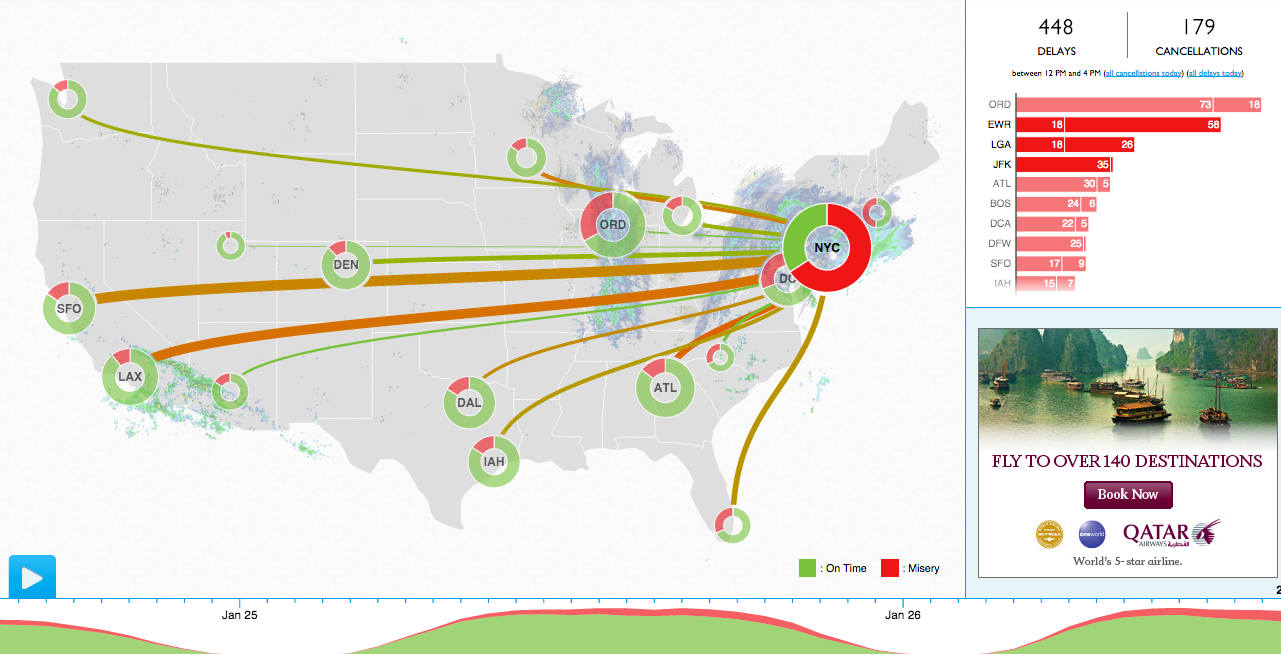
FlightAware Misery Map
Snowstorms aren't all fun and games, as anyone who has traveled by land or air during one can attest to. In 2013, popular flight tracking company FlightAware introduced their Misery Map, a fantastic way to visualize weather's impact on travel.
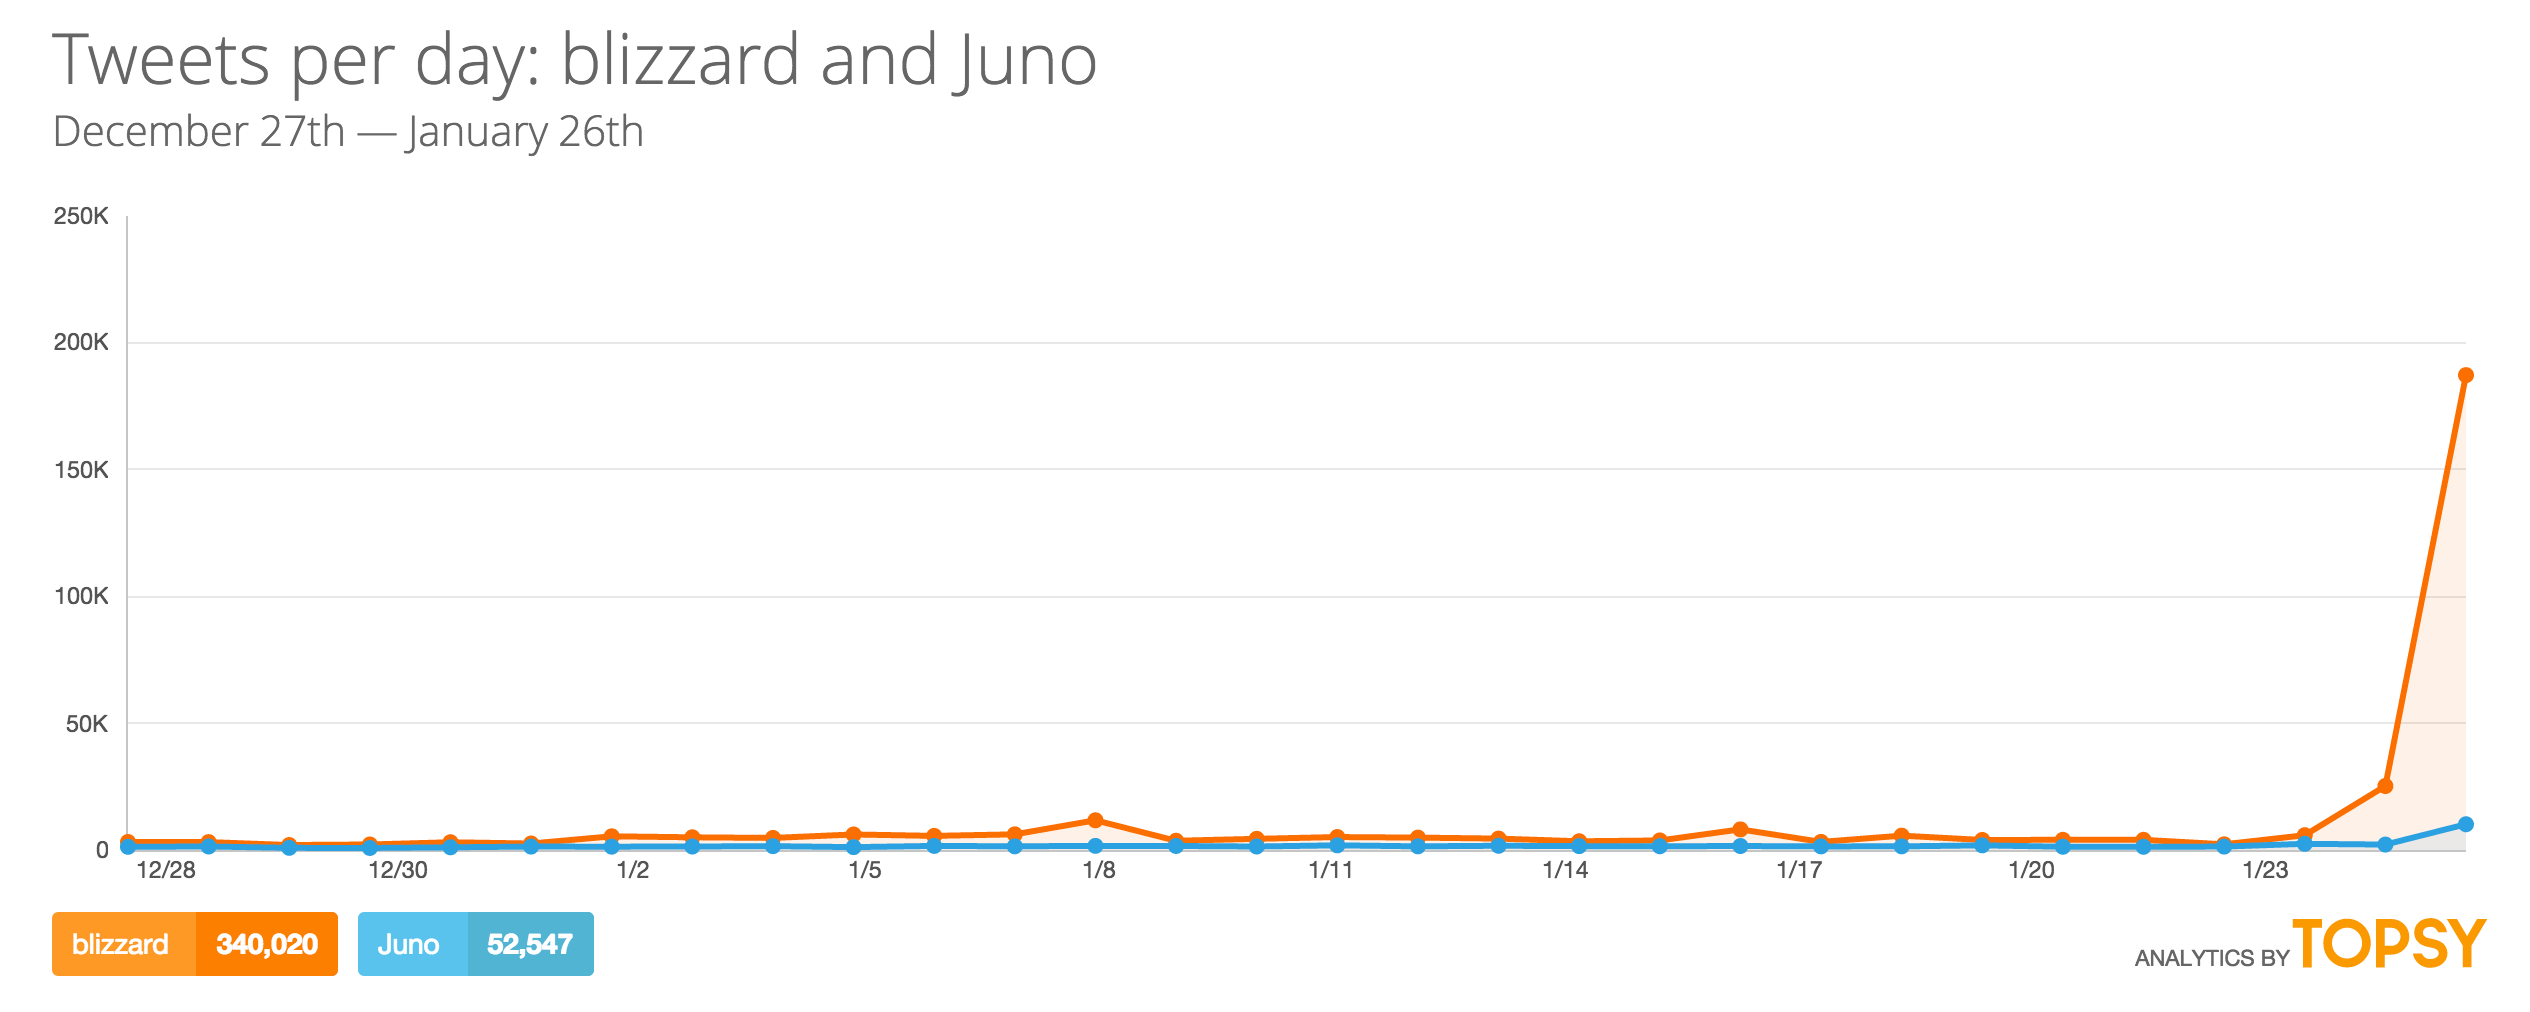
#Blizzard
This last category is somewhat of a hodgepodge of tools from social media, to weather blogs, to drones. While social media has been around since before 2010, its prevalence in forecasting, wishcasting, nowcasting, and hyping is something of a new phenomenon. Before 2010 there was no instagram. Drones have given those of us enjoying(?) 70 degree weather a chance to experience epic blizzards and feel like we're right there in the middle of it.
Twitter has become the please to discuss, share, and complain about one thing we all share together in: weather. Here's a look at Tweets per day mentioning "blizzard" between Dec 28, 2014 and January 25, 2015. Nearly 200k blizzard tweets yesterday, with the TWC storm name Juno in a close second at 10k.
It's a fun, albeit a bit chaotic, time to love and follow weather.