Updated JAMSTEC Model and Beyond El Niño

JAMSTEC Update
It has been a while since we have chatted about the JAMSTEC model and its forecast for the next several months. There is a reason for this. During the past several months, it has been forecasting colder than normal temperatures for Eastern Colorado. We've lamented in the past about why we didn't think this would happen (current strong El Niño and positive PDO), but figure the model was worth a look again. Why? Because some of what the model has been spitting out may be spot on... Let's take a look:
Temperature Forecast
December - February
March - May
June - August
In terms of the temperature forecast, one things stands out more than anything. The model is forecasting a much colder than normal December - February for most of the United States. This is especially true in the southeast 1/3 of the country. So far, the only areas to see somewhat colder than normal temperatures is parts of the west Coast and Pacific Northwest. Farther east, it has been nothing but WARM, especially along the East Coast. Does this mean that the model is wrong? Not necessarily. It may mean that January and February will turn up much colder than normal and offset the December warmth. Do I think this is the case? Not sure yet, but I do think areas that have been warm lately (East Coast) will have a colder finish to the winter. The one thing that argues against it is the strong El Niño and the lack of flow from the Arctic.
Colorado is on the western side of that colder anomaly, and we certainly haven't been colder than normal. Given the above reason that I mentioned, I doubt if the rest of the winter will end up colder than normal. However, I continue to believe and agree with the JAMSTEC that the spring will offer colder than normal conditions. This is consistent with what occurs during a weakening El Niño and a more active storm track (i.e. wetter pattern). The model also favors a cooler than normal summer... More on that in a bit.
Precipitation Forecast
December - Feburary
March - May
June - August
The precipitation forecast certainly looks nice. It keeps Colorado "in the green" for the rest of the winter and spring, and favors Southeast Colorado with wetter than normal conditions during the summer. Again, I am still somewhat skeptical that the rest of the winter will be wetter than normal for Eastern Colorado. I do continue to agree with the model that the late winter and spring will be wet, with a drying trend into the summer. Really, nothing has changed on that front.
Beyond El Niño
I remain concerned with what happens when this El Niño weakens (i.e. potential dryness). Because when it starts to fade, I believe it will fade very quickly. Here is the latest IRI Plume of Model ENSO Predictions:
Notice that after the December, January, February timeframe, this El Niño is forecast to weaken rapidly. In fact, the Scripps Model (blue line) weakens this event very quickly and takes us to strong La Niña status by this summer! While I think that is a bit fast, I do think it has the right idea. The graphic below is a comparison between this El Niño, and the events in 1982-83 and 1997-98.
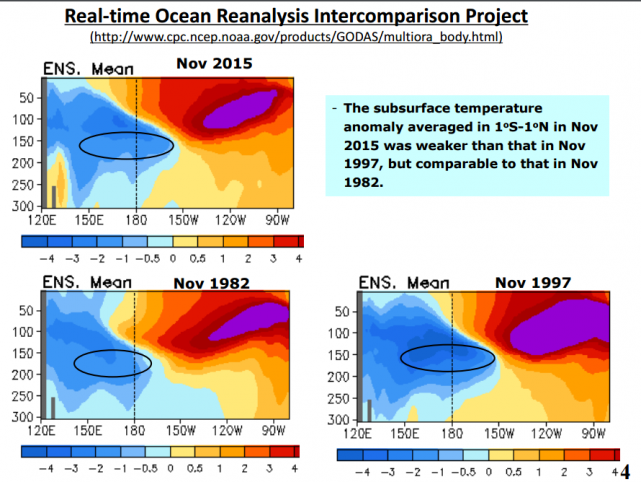
What you see is the measure of how warm or cold the water is from east to west across the Pacific, and how deep those temperature anomalies extend. While the current El Niño is strong, it is quite a bit weaker in magnitude when compared to the 1997-98 event. The coverage of warmer than normal water was greater in 1997-98 and the warmer water extended deeper. The one similarity is the colder than normal water that built and is building beneath the surface during all three events. Again, the cold plume is stronger in the 1997-98 event, but the current event isn't far behind and it is more impressive than 1982-83. That colder than normal water is lurking and will make its presence felt when this El Niño disappears and the overall Pacific cools. Why is this significant? As I have shared with many of you, I believe a La Niña event will follow this El Niño. History shows it has happened...
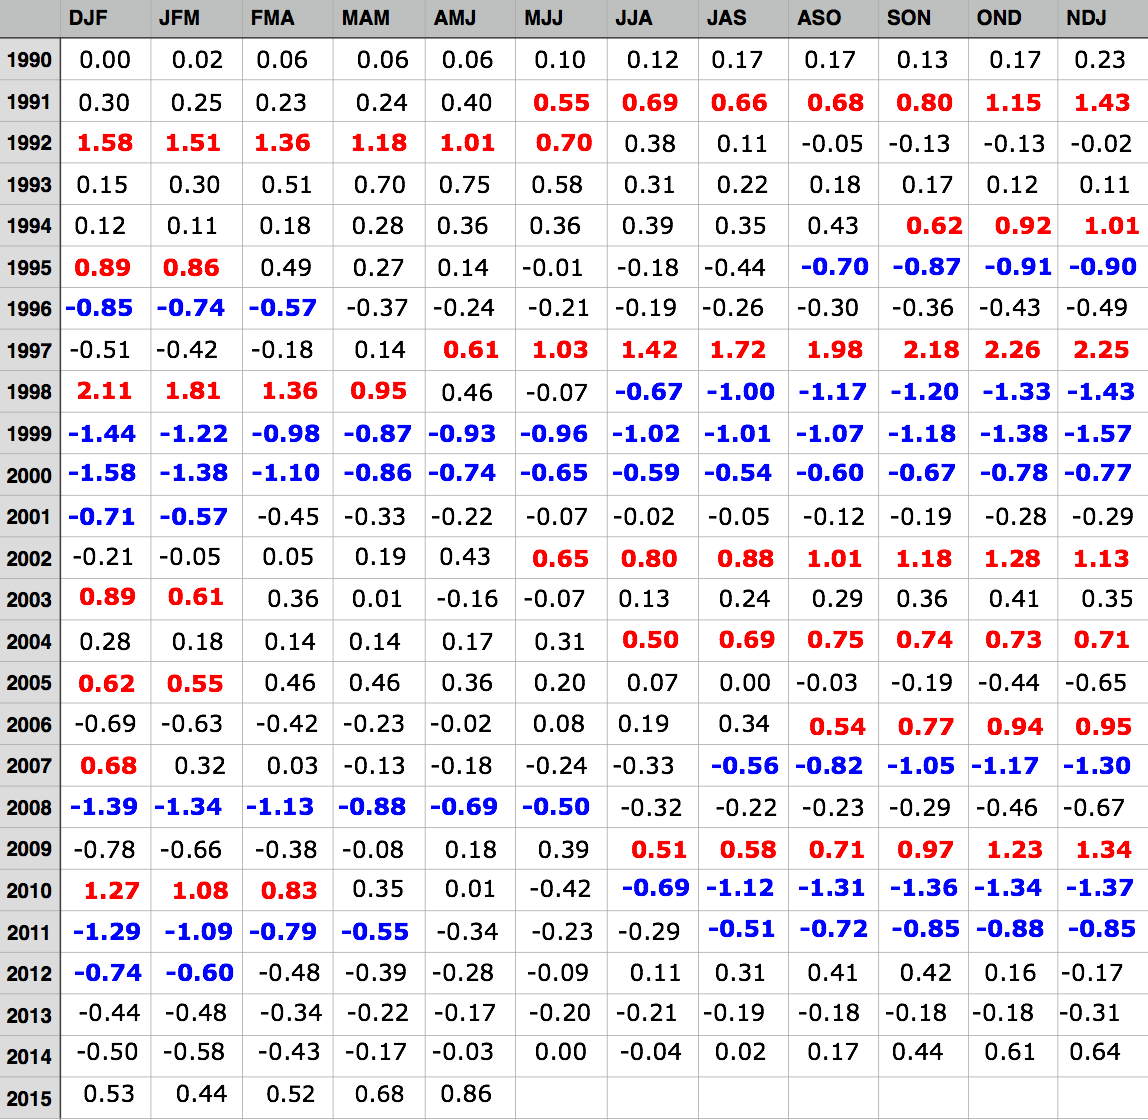
Simply put, the "red numbers" indicate an El Niño in progress while the "blue numbers" indicate a La Niña in progress. Notice that after the 1997-98 El Niño a rather strong La Niña followed. The same thing happened after the weaker 2006-07 and 2009-10 El Niño events. If we want to take this WAY back into the history books look at what happened in the last 1800s:
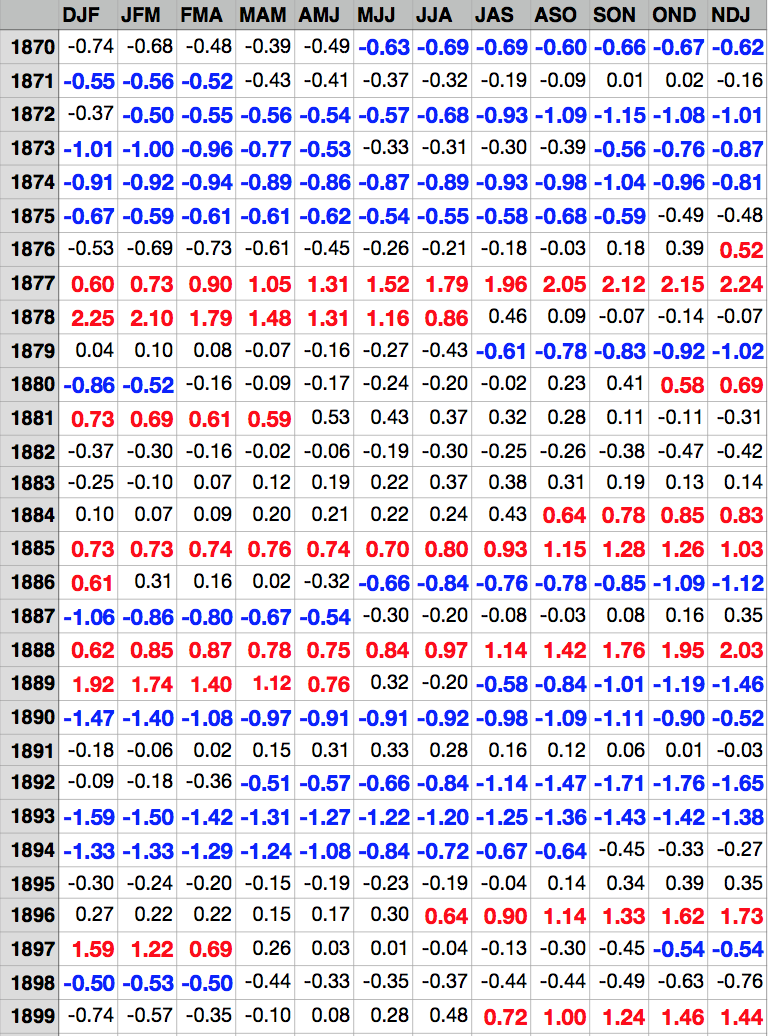
Notice the similarities? Absolutely. Recently, the Pacific Decadal Oscillation weakened from a value of 1.46 in October to 0.86 in November. While it is still positive, it is nowhere nearly as positive/warm as it has been during the past year or so. Again, why is this significant? We have been blessed with great drought ending moisture during the past two years. Once the Pacific cools back to a predominantly negative/cool PDO along with a possible La Niña, we will dry out east of the mountains. I feel this will be especially true south of the I-70 Corridor all the way into the Southern Plains of New Mexico and Texas. If we dry out sooner rather than later, that "cooler than normal summer" the JAMSTEC is forecasting would be bogus. Drought would set in, and we would be the exact opposite. I believe this could cause severe hardships on agriculture and bring back some pretty vicious wildfire seasons. In my opinion, NOTHING is harder on agriculture than drought. I have stressed for many years now that the time to craft your drought plan isn't during the drought, but during the wet times. While we are doing well in the moisture department right now, I feel our time is running out. I always say that I am not the smartest person in the room when it comes to long range forecasting. However, I pay attention to history and couple that with the models, and I see trouble ahead. Plan accordingly.