The State of the Atmosphere: Sunday, April 6, 2014

April to remain active
In some of my previous posts I have been talking a lot about how April and May would likely be much more active than March. I also mentioned how April could very well be "the tell" in regard to our spring and summer pattern. Recently, while I was addressing a group in Rocky Ford I told them not to get excited about the first storm that moved through in April, but get excited about the second one. Well, we just had a pretty decent storm for a large part of eastern Colorado. Good snow totals along and east of the mountains (some as high as 10-20" close the mountains), with parts of the far Eastern Plains getting between 3-5" of heavy wet snow. Here in Colorado Springs, I recorded 8-9" of heavy wet snow! That was the heaviest snow I had seen at my house (on the east side of town) since October of 2006, when I had about 12". Pretty impressive.
Will April continue to be active? Well, I think it is a done deal that the rest of April will be active. The problem with simply saying that, is that it just doesn't tell the whole story. We can be in an active weather pattern, but not necessarily reap the benefits of said pattern. It all depends on where the storm track sets up, and how the storms move through our area that determines whether we see beneficial moisture or not. I want to give you a peek behind the curtain and show you why I believe the rest of April will be active and possibly when future storms will be moving through.
The maps below are tied to the GFS Model in what we call an ensemble forecast. An ensemble forecast is where multiple numerical predictions are conducted using slightly different initial conditions that are all plausible given the past and current set of observations, or measurements. For a more detailed definition click here.
These maps are of the 500mb level (mid levels of the atmosphere) and are used frequently to determine where the main pocket of energy (cold pool aloft) is located with a particular storm and where it may be heading.
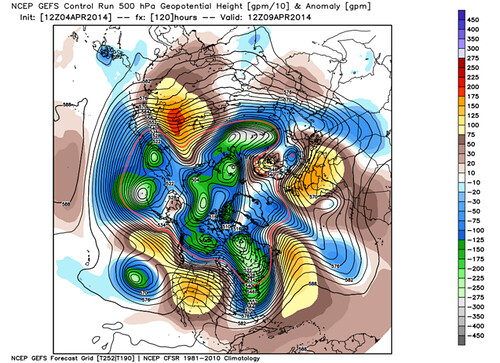
This above map was made today by the GFS Ensemble and shows our forecasted global weather pattern for Wednesday, April 9th. Notice the yellow and orange coloring over the western half of the United States. That yellow and orange is indicative of a strong ridge of high pressure, which is likely to give us a nice and warm weather. Conversely, the blue and green areas show troughs of low pressure and are indicative of colder and stormier weather.
While I am a fan of the nice warm weather that will likely occur in Colorado during the middle of next week, I actually have my eye on the green and blue area off the west coast of the US. That is where our next storm is located.
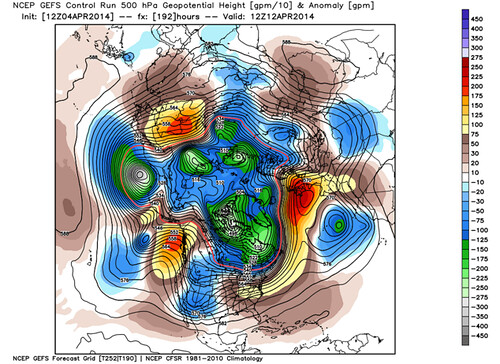
This map fast forwards a few days ahead Saturday, April 12th. It shows a very pronounced trough of low pressure from Montana southward to Mexico. There is also a nice pocket of energy moving through the Four Corners area at this time. That little piece of energy could very well give us another good chance for moisture across the whole state. This is storm #1.
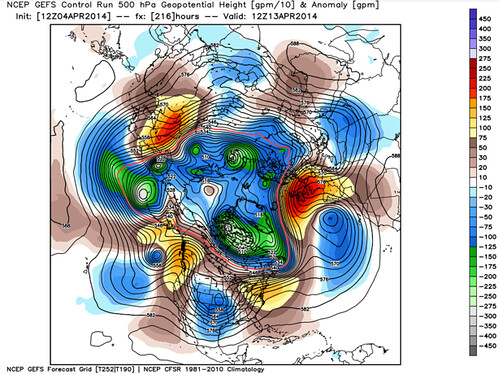
This is an image of Sunday, April 13th. Plenty of "blue" or troughiness from Wyoming to the Gulf Coast. See that little circle centered over Kansas? That is a strong and closed area of low pressure. Thus, the model is forecasting that storm to move through Colorado or near Colorado between the 12th and 13th, and intensify as it is doing so. This is a look at storm #1 as it is departing our area.
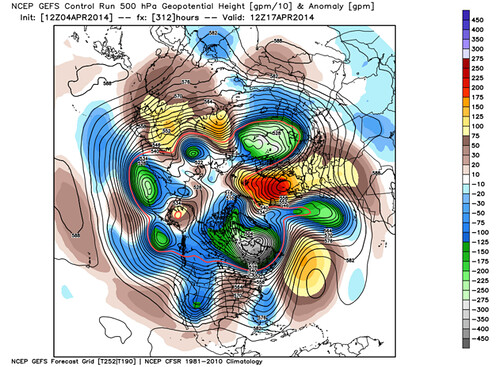
Storm #2 shows up in the map above on Thursday, April 17th. Again, note the troughiness in the western half of the US. If you look near the Four Corners area again, you see a little kink in the flow that is indicative of another strong area of upper level low pressure. It is taking a very similar track to the storm from April 12th-13th. When we are tracking storms, we want these strong areas of low pressure to go just south of Colorado, across New Mexico. That type of storm track puts us on the colder, stormier, and usually wetter part of the storm.
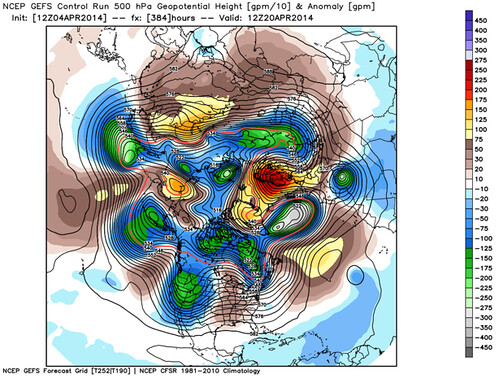
The above map is for Sunday, April 20th. The whole western US is under the influence of a strong trough of low pressure. It extends from the Pacific Northwest to the Desert Southwest. This could very well be storm #3, depending on how it tracks.
What I am trying to show you is that our weather pattern has changed greatly from the weather pattern that controlled us through March, and for most of the winter. In previous months, we would have a large ridge of high pressure in the western US that would deflect storms to our north and east. That type of pattern kept the coldest and stormiest weather in the eastern half of the country. Now, it looks as if that ridge will be replaced with a storm generating trough of low pressure, which will keep our weather pattern very active.
As you know, the devil is always in the details. Does this guarantee us seeing a lot of beneficial moisture? Absolutely not. Does this guarantee us much better chances for moisture when compared to March? Absolutely.
I like how the models that look 16 to 32 days down the road are keeping these storms just to our south. That puts us in a favorable spot to have decent chances for moisture. If they go north, then our chances are greatly reduced. By nature I am not a gambling man. But, given what I have shown you and additional things that I am looking at, I would place a few bets on April and eventually May paying off, on the wet side for us.