Monsoon Outlook, Continued Weak to Moderate El Niño Development

Given the fact that our spring and early summer, together, have given us some much needed moisture (for most of the state), a lot of folks are wondering if the trend will continue. 'What does the monsoon season look like?' is the number one question I am getting right now. It's a valid question too, and one that is quite important when considering wildfire potential. We've had all of this great moisture and the vegetation has been loving it (minus the hail) and is growing nicely. But if we dry things out, all of that nice vegetation ends up being a substantial fuel source for any wildfire that gets going. So, lets look reasons why I believe the monsoon season will be an active one.
Madden-Julian Oscillation
We've talked about the MJO in detail before, and here is a look at what state it is in now.
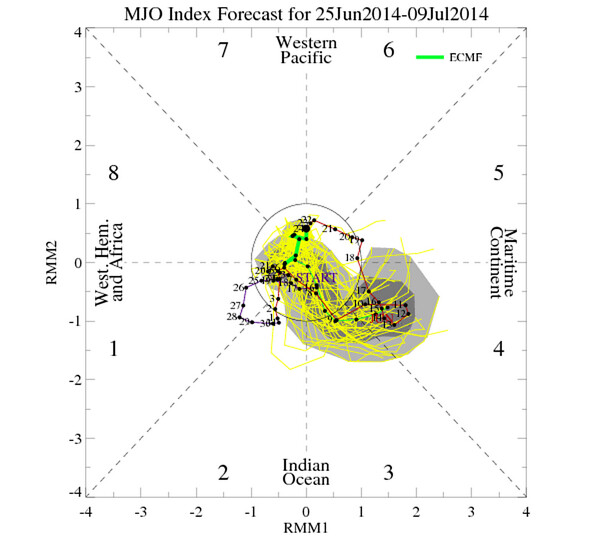
The chart above focuses on the current phase of the MJO and the ECMWF forecast of the MJO. The ECMWF seems to do the best job at forecasting the MJO and is certainly the preferred model. The yellow lines show the different forecasts that the model is making for the MJO, while the green line is the average forecast position of the MJO within that forecast set.
Remember, the closer the signal is to the center of the chart, the weaker the MJO. The farther it gets from center, the stronger the signal. Right now, the model shows an intensifying signal going into July and the MJO favoring phase 3 and 4. What does that mean for us? Lets look. . .
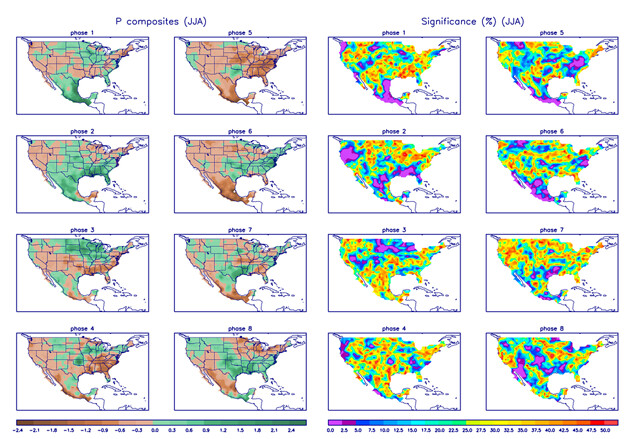
Notice that when the MJO is phase 3, we are usually drier than normal. However, as it enters phase 4 we start to moisten up quite a bit. This transition (from phase 3 to 4) or first good push of monsoon moisture will likely occur sometime between July 10-15th. That being said, we are not talking about a strong MJO signal during this time. In fact, the MJO is usually at its most inactive during the summer months. Bottom line, I do not see the MJO as a major player this monsoon season, but possibly an initiator early in the season.
Southern Oscillation Index (SOI)
The Southern Oscillation Index deals with pressure patterns between Tahiti and Darwin, Australia. It is often used as a gauge to reflect if we are to enter or maintain an El Niño or a La Niña episode. The lower the index, the more likely we will either enter or maintain an El Niño. The higher the index, the more likely we will either enter or maintain a La Niña episode.
You have heard us talking about us moving into an El Niño episode for a while now. We have been mentioning the likelihood of a weak to moderate El Niño event to finish 2014 and enter 2015. Why have we not been mentioning a strong El Niño episode? Because of the way sea surface temperature anomalies and the SOI are behaving. The map below focuses on sea surface temperature anomalies across the Pacific Ocean. As you can see, the Pacific is quite warm right now, especially along the equator.
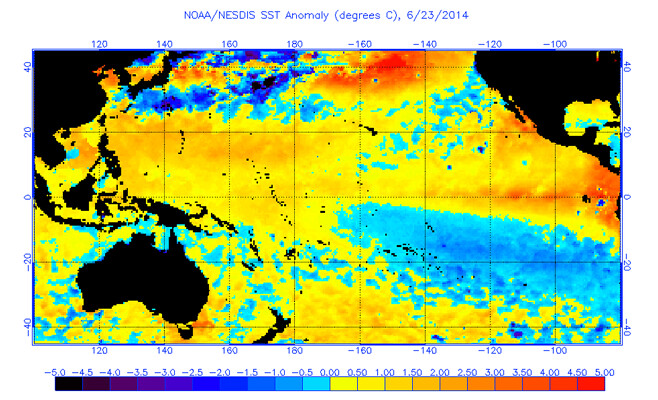
With the whole ocean being in a warm state right now -- The Pacific Decadal Index (PDO) at 1.81, its most positive since spring of 2005 -- the SOI has a hard time dropping, thus keeping El Niño development in check for the time being. We need the western Pacific to cool, while the eastern Pacific warms. This creates a pressure difference between Darwin and Tahiti, which helps foster a lowering of the SOI and thus allows the developing El Niño to take hold and "couple" with the ocean and atmosphere (important). Right now, the SOI is actually slightly positive. . . see for yourself:
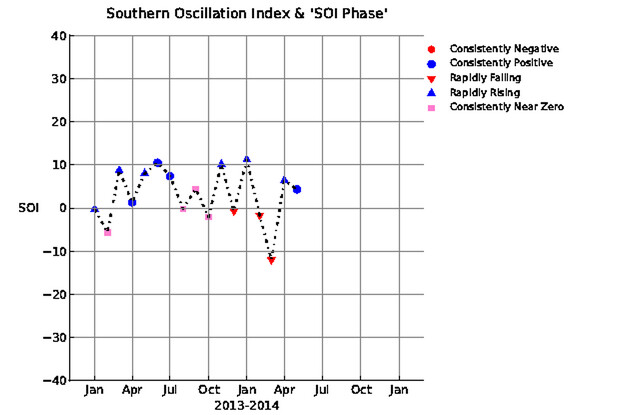
As Matt Makens showed in a previous post, we are not in an El Niño yet. We are still in a neutral state. Until the SOI drops considerably, we will not enter El Niño territory.
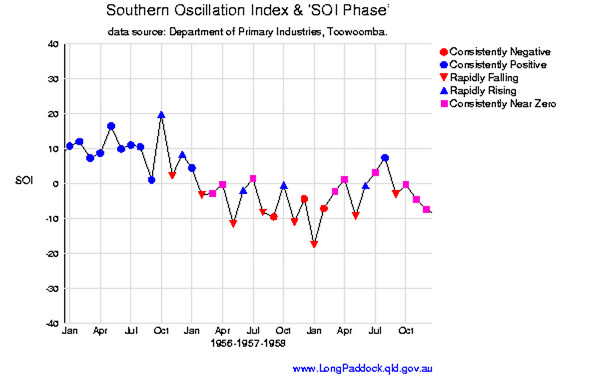
Where was the SOI during 3 of our favorite analog years?
1957
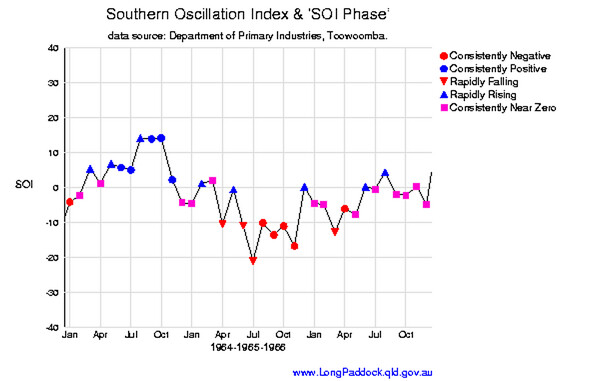
1965
2009
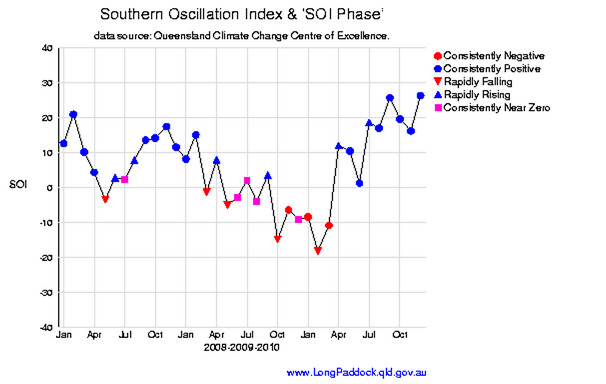
Notice that by July of all three of those years, the SOI was lower than where we are now. As I have said, we have some work to do before we start talking about a full blown El Niño episode. Models still support El Niño development. The JAMSTEC Model seems to have the situation well in hand from a forecasting perspective:
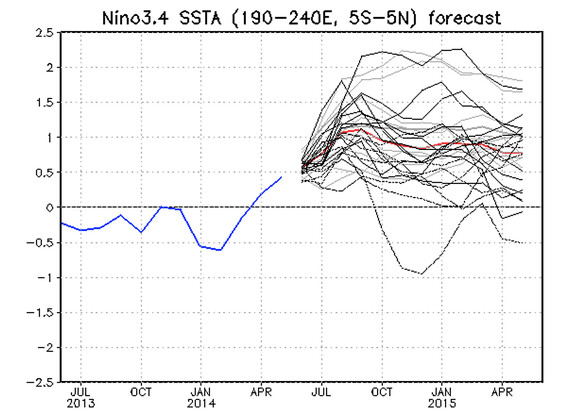
The red line and "spaghetti lines" all indicate weak to at the most moderate El Niño status by later this summer and through the winter. But remember, there are always other elements at work when it comes to a long range forecast. Per one of my previous posts, it isn't just about whether we are in an El Niño episode.
Oh, I mentioned "analog years" above. . . I'll tell you what that is now.
Analog Years
An analog year is a previous year that has very similar characteristics to the ongoing year and the months that lie ahead. For example, the same oceanic phases (AMO/PDO), whether we are neutral or in an El Niño or La Niña, etc. We match up the majority of those players and look through history to find a particular year or years that most closely match.
The analog years that we are using going forward are 1957, 1965, and 2009. So, if we look back at the monsoon seasons (July, August, September) of those years, it helps us get an idea of what we may experience. Below is the precipitation anomaly map for those years I mentioned.
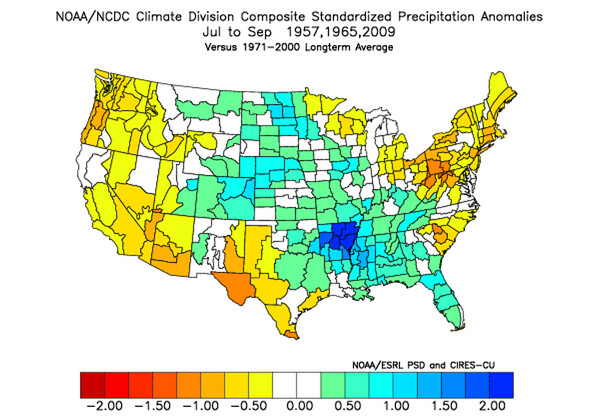
The green and blue areas show where it was the wettest. The yellow and red areas show where it was the driest. Notice that all of Colorado had above normal moisture during the monsoon seasons of those years. Can that be skewed? Absolutely. . . 1965 was one of the wettest summers on record for Eastern Colorado, especially June-August. So, 1965 is likely skewing the data a bit high, but not excessively so. Bottom line, we certainly didn't struggle with a lack of moisture during these years.
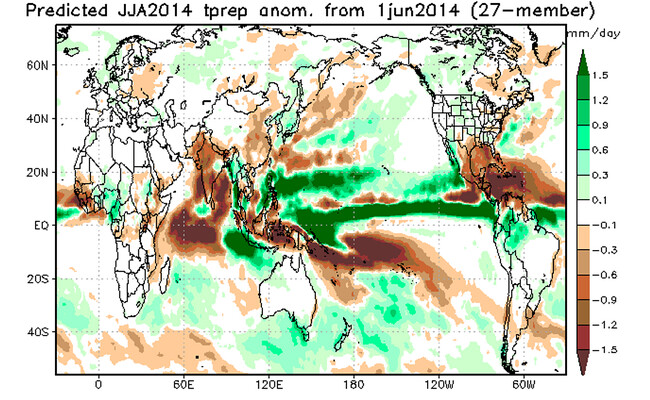
JAMSTEC Model Precipitation Forecast
June - August:
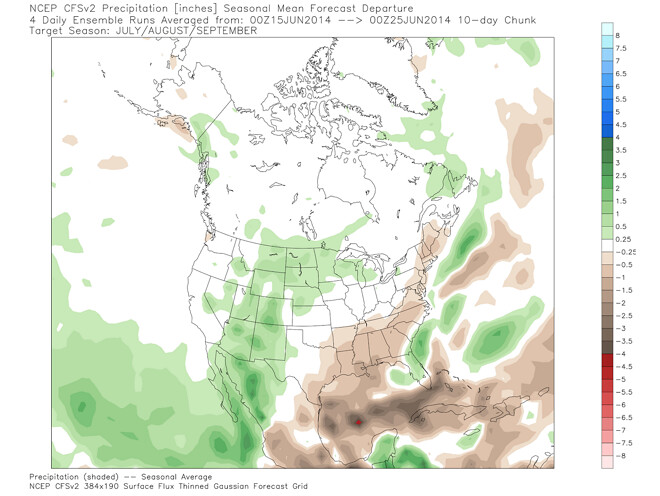
CFSv2 Precipitation Forecast
July - September:
September-November:
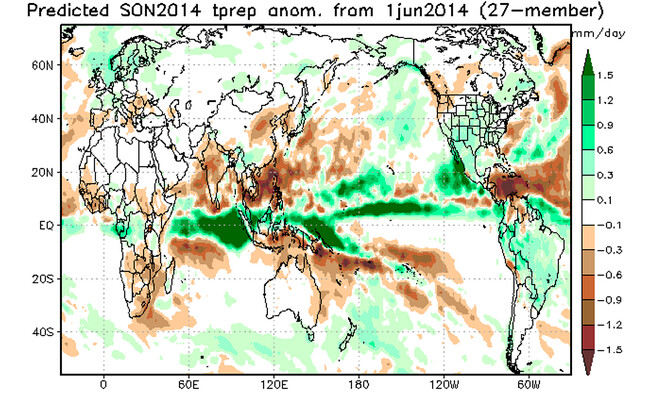
As you can see above, the JAMSTEC shows a slightly wetter than normal monsoon season. This is especially true for the late monsoon season, before we enter into a very wet time between September-November. While I think the CFSv2 doesn't have as good of a handle on the overall forecast, I do think it has a good idea for the monsoon. This developing El Niño, and if nothing else the quite positive/warm PDO, will enhance Eastern Pacific hurricane activity. Some of that moisture will likely get caught up in the normal monsoon plume, and get deposited in the form of heavy rain in the southwest third of the country.
I know I've thrown lots of information at you in this post, but I really want you to understand the why something is about to happen or not happen, before it happens or doesn't happen. That is one of our big goals at Weather5280.com.