El Niño Status and Forecast

It has been a while since we’ve talked about El Niño, so I figured I would give you an update. Here is what the most recent sea surface temperature (SST) anomaly map looks like:
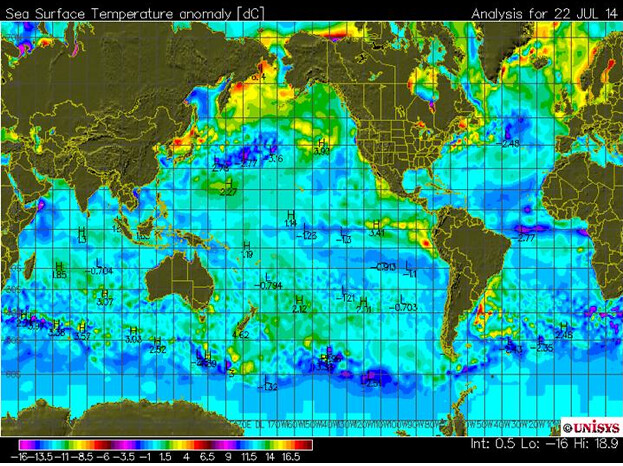
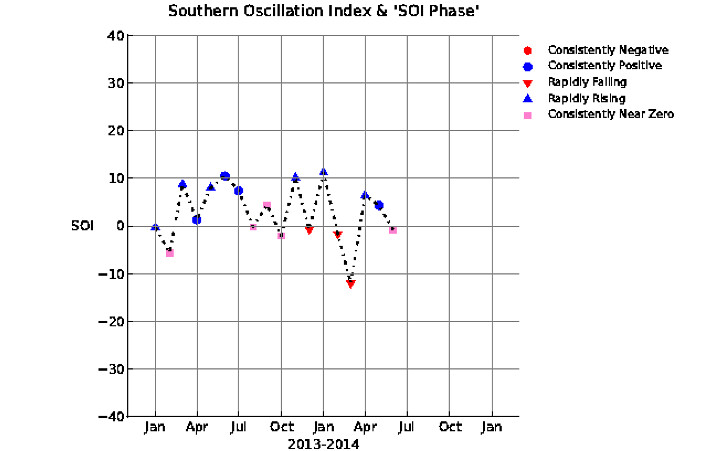
As you can see, a warmer than normal pool of water is located off the west coast of South America in areas referred to as Niño Regions 1+2. Farther west across the Pacific the water is actually a bit cooler than normal until you get to the western Pacific Ocean. In order for the El Niño to develop in a traditional fashion, the water must cool in the western Pacific Ocean allowing the Southern Oscillation Index to drop and the subsequent oceanic and atmospheric coupling to take place. Sounds like a lot of geek speak…but the way things are structured right now, a traditional El Niño will struggle to form. Recently the SOI has started to drop a bit, but has a long way to go to where it indicates a true El Niño:
So, if a traditional El Niño doesn’t look as if it’s going to develop does that mean we won’t see an El Niño? No, just a different type. Modoki is the Japanese term for “similar, but different”. A Modoki El Niño is a specific sub-type of El Niño pattern that has the warmest water in the central and western Pacific Ocean. This is what a Modoki El Niño would look like in terms of sea surface temperature anomalies:
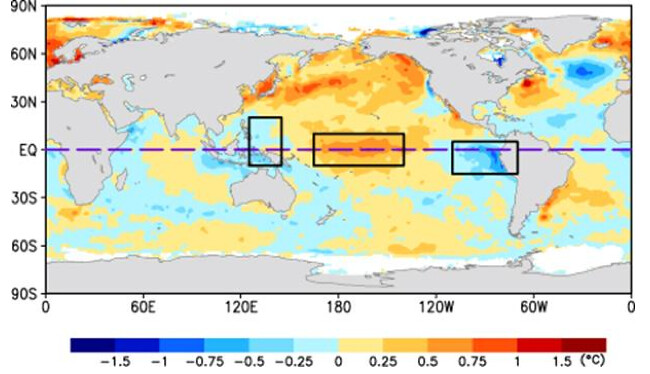
Notice where the warmest water resides in the equatorial Pacific Ocean, right in the central/west central region. Comparatively cooler water is located just off the west coast of South America, where the warmest water exists as of right now. The transition that takes place in the next few months will likely allow the water off the west coast of South America to cool, while the central Pacific warms.
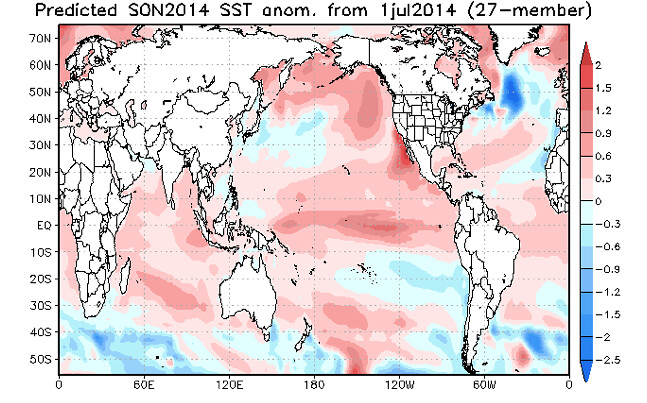
Does a Modoki El Niño mean the same as a traditional El Niño? Not exactly, but for some areas it can be very beneficial with moisture. One model that seems to have a nice handle on the overall transition and setup is the JAMSTEC Model. This model is out of Japan and is a very good model. Looking ahead, here is what is what it suggests will occur in terms of sea surface temperature anomalies for the next several months:
JAMSTEC Sea Surface Temperature Anomalies Sept-Nov:
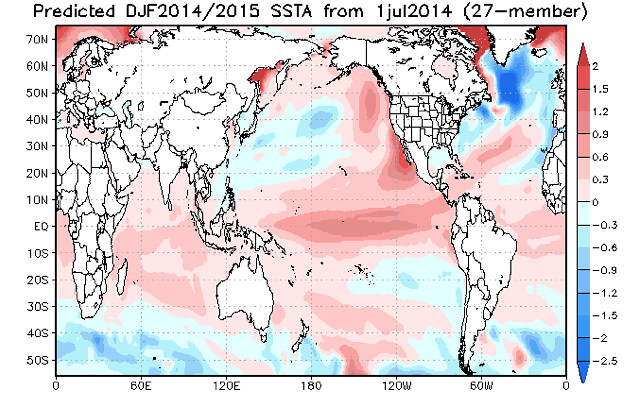
JAMSTEC Sea Surface Temperature Anomalies Dec-Feb:
JAMSTEC Sea Surface Temperature Anomalies Mar-May:
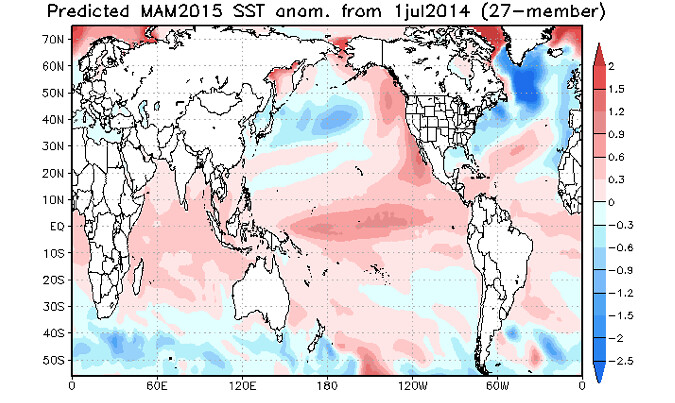
Notice how the core of the warmest water stays mainly in the central Pacific Ocean, instead of emanating solely off the west coast of South America (as in a ‘typical’ El Niño). Another thing I am watching is that most of the Pacific basin is somewhat warmer than normal. This likely means we will keep a relatively positive/warm PDO for the next several months. Remember, a positive PDO usually helps us out in the moisture department (it has been positive since January).
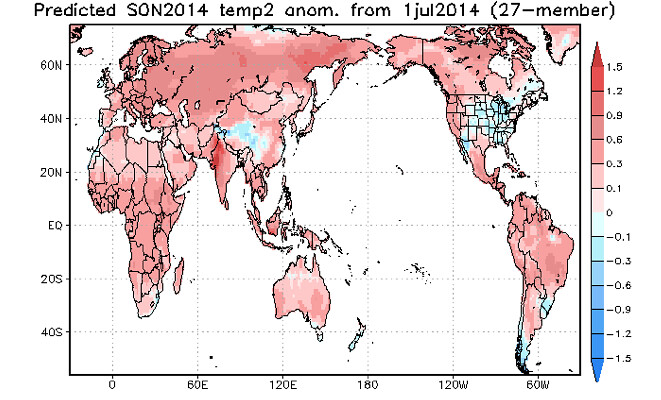
JAMSTEC Temperature Anomalies Sept-Nov:
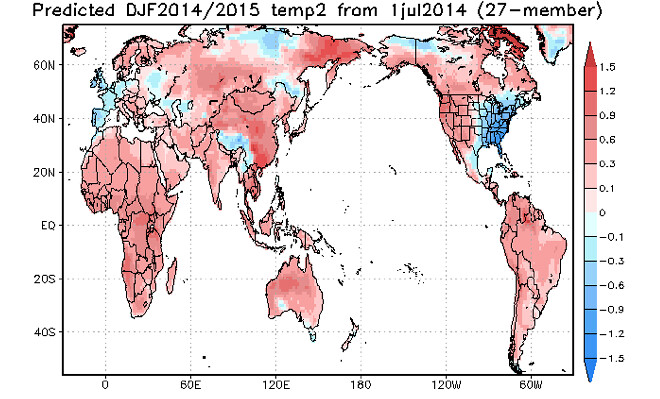
JAMSTEC Temperature Anomalies Dec-Feb:
JAMSTEC Temperature Anomalies Mar-May:
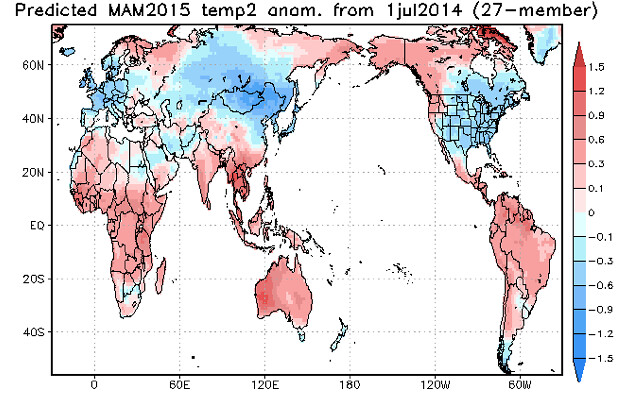
Per the maps, red means warmer than normal and blue means cooler than normal. Usually during a Modoki El Niño, the east and southeast 1/3 of the country is cooler than normal for the fall, winter, and spring. This version of the JAMSTEC has the main cool signal over a smaller area of the Eastern US than usual, and then keeps most of the US cooler than normal into the spring months. Overall, I think the temperature profile looks spot on as to how a Modoki El Niño impacts the US.
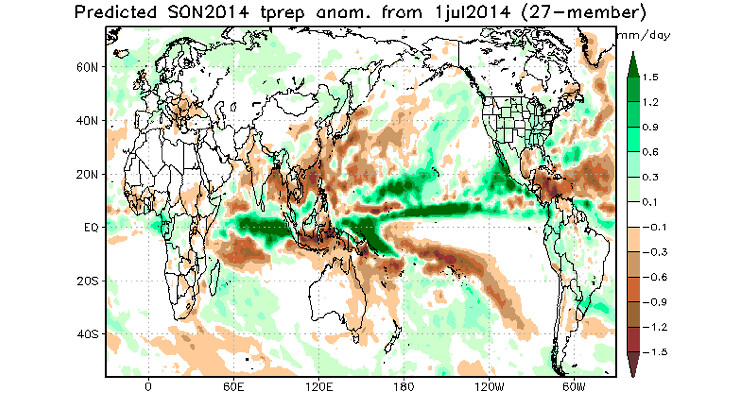
JAMSTEC Precipitation Anomalies Sep-Nov:
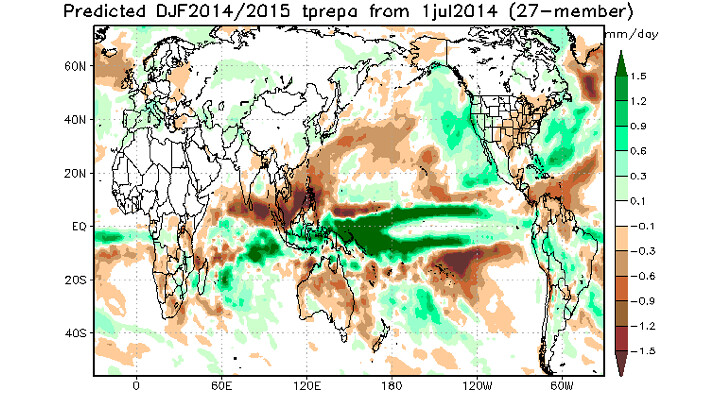
JAMSTEC Precipitation Anomalies Dec-Feb:
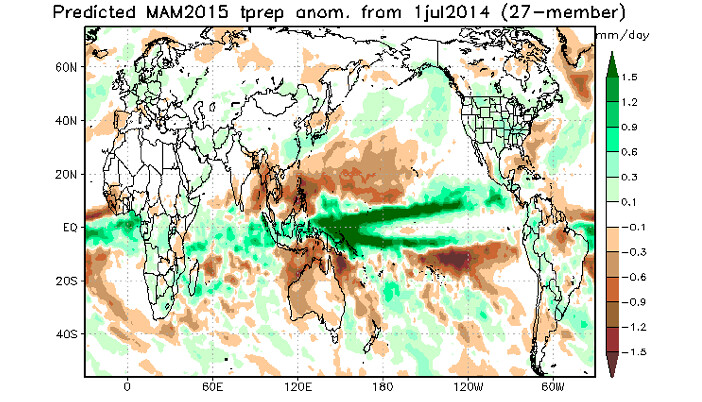
JAMSTEC Precipitation Anomalies Mar-May:
The green color means wetter than normal conditions, and the brown means drier than normal conditions. The JAMSTEC has much of the Western US wetter than normal for the late summer and fall. I believe this is due to what will be an active Eastern Pacific hurricane season. Some of that moisture will enhance our monsoon, and maybe keep us wetter longer than usual.
It then has much of the southeast half of the US drier than normal for the heart of the winter. This is somewhat unusual, considering that the same area is progged to be cooler than normal during the same timeframe. Cooler than normal would imply an active storm track or at the very least, several major cool shots dropping into the eastern half of the country. When that happens, the pattern is usually wetter than normal.
The spring then turns around and shows up wetter than normal for much of the US, especially some of the same areas that are progged to be so dry during the middle of winter. Kind of a weird outcome if you ask me… Why? Because my favorite analog year for what is to come is 2009-10. During that time, the southern tier of the US was very cool and very wet. This was also at the same time that a Modoki El Niño episode was occurring. In fact, check out the map below that shows the temperature anomalies across the U.S. from September of 2009 through March of 2010:

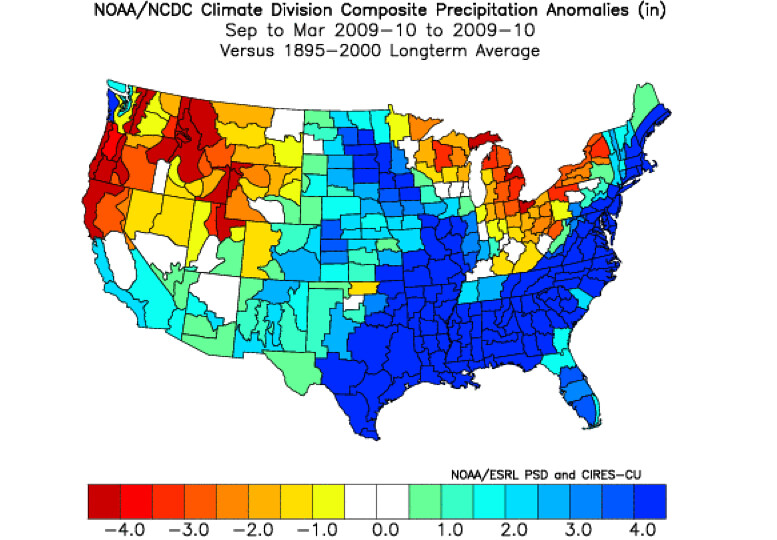
All of that blue and purple is much colder than normal air that dominated much the US…especially the southern tier. Moisture was in no shortage for the area either. The map below shows wetter than normal conditions (blue shading) for many of the same areas that were cool too.
This is kind of why I am skeptical of the dryness the JAMSTEC is showing for the Dec-Feb timeframe, but not necessarily for Colorado. I am skeptical of the dryness that shows up in the model farther east. Does that matter? Maybe, maybe not, but in terms of giving the model a higher weight of accuracy, I think this is important. For Colorado in late 2009 and early 2010, most of that above normal precipitation fell in the fall and early winter (October 2009 is legendary for the Wet and Sangre de Cristo Mountains of Southern Colorado). Then we kind of dried out during the heart of winter and into the spring. Per our discussion above, the JAMSTEC has us wet in the fall, somewhat dry in the winter, then wet in the spring again. Is that really that out of the ordinary? Do we ever see big winter storms in December, January, or February? Sometimes, but keep in mind that it is those early and late season storms that are usually the biggest and most beneficial to us east of the mountains. Plus, the PDO wasn’t as warm in 2009-10 as it is now, and I think that is important. A warm PDO is usually kind to Colorado when it comes to moisture and I believe it has been instrumental in helping erase the drought during the first half of 2014.
I know this is a lot of information, but for those that read us, you know that is what we are all about. Making sense of the chaos and helping you understand what is to come in the long range is something we love doing. Needless to say, we’ll be watching it closely for you.