Winter Outlook 2014-2015, Part 1: Analogs

If you didn’t attend the Weather5280 Meetup last week, you missed a great hang, but fear not: a) we’re likely to have another one in the coming months; b) I’m going to share a lot of the same material that I talked about that evening, and how it relates to what will happen for our winter/spring 2014-15. So, here we go...
Sea Surface Temperature Anomalies:
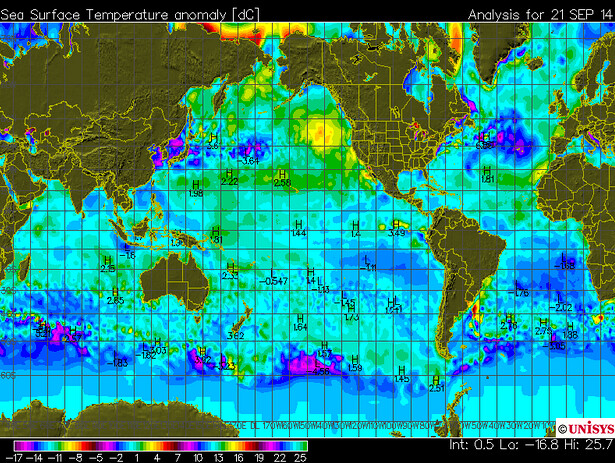
The above image represents how the sea surface temperature anomalies looked on September 21st, just one month ago.
Here is how they look now:
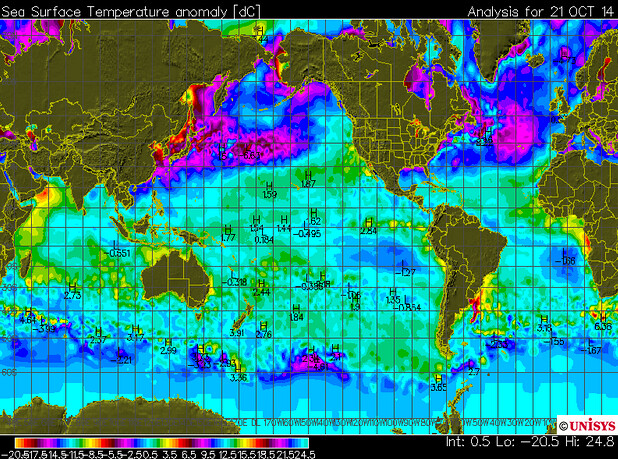
Notice how much the northern Pacific Ocean has cooled! It is completely different than it was a month ago. This has allowed a blocking ridge of high pressure to break down, which is allowing more storms to come into the West Coast. This is potentially quite good news for California, as it could well allow for more storms to impact the state. Part of this is due to seasonal change, but the overall shift that is occurring in the Pacific is mostly responsible due to the current PDO phase and some sort of El Niño episode that is trying desperately to get underway. You hear me mention the PDO a lot, because it plays such an important part in our weather. While we are predominantly in the cool/negative phase of the PDO, we have taken a short detour to the warm/positive phase in the PDO since January. We still have a +PDO, and I believe it has been instrumental in helping erase drought conditions for the whole state. In fact, check out these moisture totals since April across Colorado:
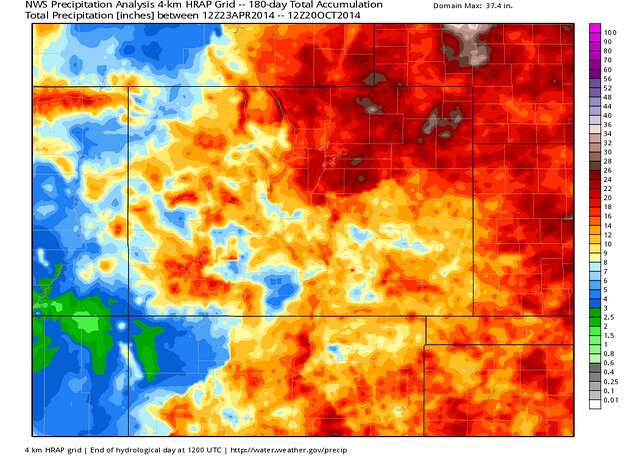
Some areas along and north of I-70 have received between 20 and 30 inches of moisture! Conversely, areas south of I-70 haven’t received as much. However, the moisture that they have received has gone a long way in helping cure the awful drought. The most recent drought monitor suggests that too.
Here’s how things looked just five months ago on May 20, 2014.
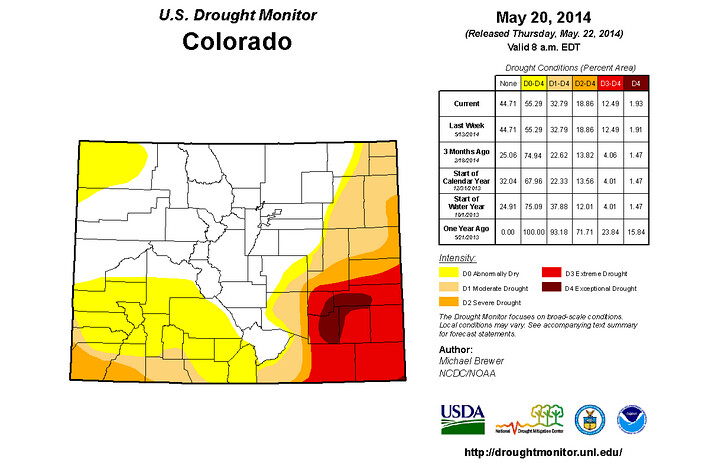
Much of the drought that you see above was the result of two years of below normal moisture. In fact, that two year period was one of the driest on record for many areas in far Southeast Colorado. I firmly believe that it was a result of the PDO being in a long term cool/negative phase. That phase is more prone to La Nina episodes which are notoriously windy and dry for many areas east of the mountains.
Here’s the most recent drought monitor:
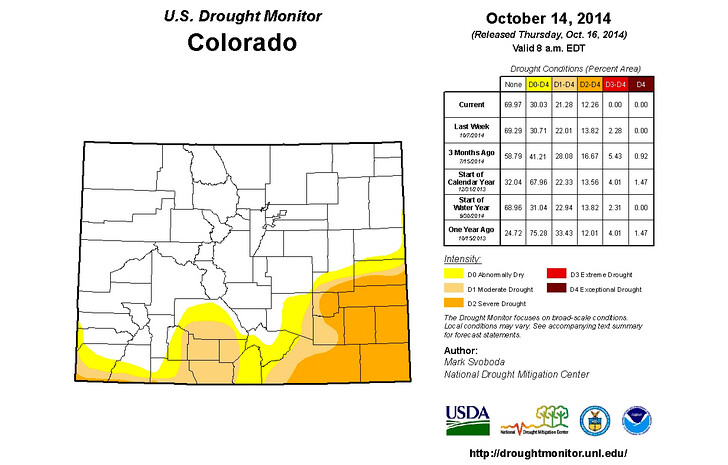
Bottom-line, the short detour in the PDO to a warm/positive phase has been very instrumental in helping us in the moisture department.
Here is a look at sea surface temperature (SST) anomalies associated with the two phases of the PDO:
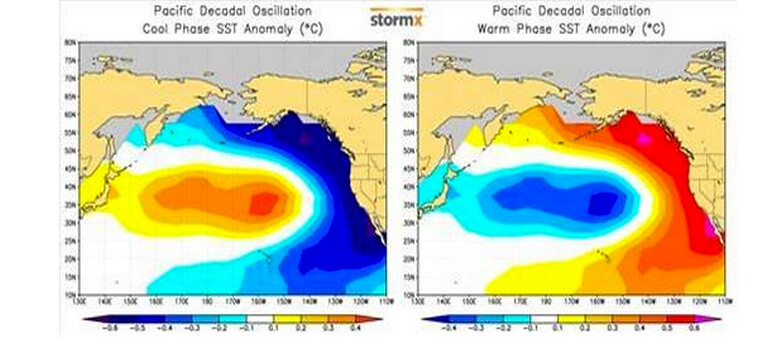
If you look at the SST anomaly maps above, you will see that we are dealing with a warm/positive PDO. However, I believe that this phase of the PDO will be pretty short lived. Thus, we had better continue to capitalize on it in terms of moisture, before we go back to a pattern that will be more conducive to drought conditions once again. Let’s see if that is possible…
Analog Years
You have heard me mention analog years before. These are simply other years in the past that have similar global weather patterns to those that are occurring currently. Contrary to the belief of the Climate Prediction Center, they are a very important part of long range and seasonal weather prediction. In fact, through about mid-to-late summer this year, 2009-10 was acting like it would be the perfect analog year to project the rest of 2014 and into 2015. While it is still in the running, there are other years that look even better. We have to break them down in terms of what the SSts looked like during each particular year, then we can see how the temperature and moisture panned out.
1957-58
Sea Surface Temperature Anomalies October - May
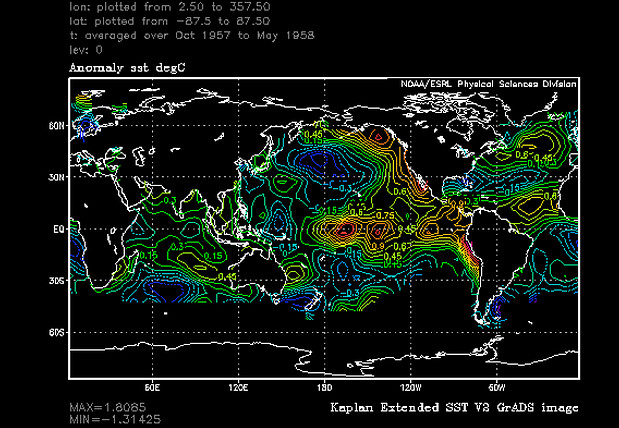
This has a similar look to what’s happening now. We see colder than normal water extending eastward from Japan, warm water in the ENSO (El Niño Southern Oscillation) region extending westward from South America, and some residual warm water along the western coast of North America.
Temperature Anomaly October - May
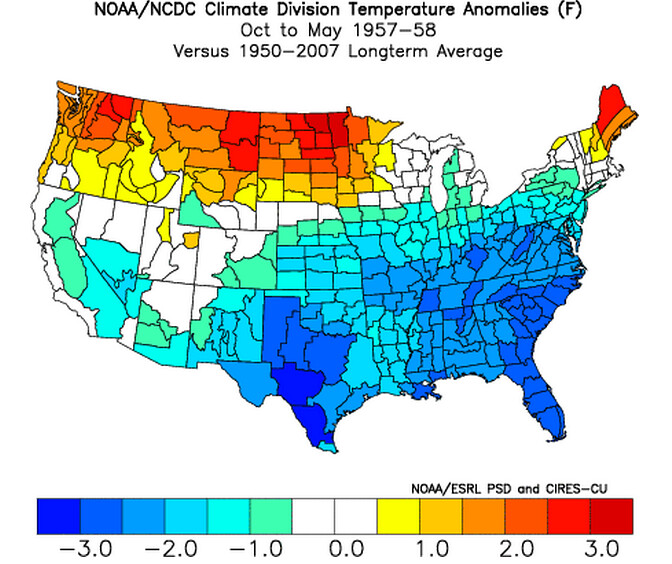
Yellow to red means warmer than normal, while the greens and blues mean colder than normal. In general Colorado was normal to slightly colder than normal, with the coldest weather being just east and south of us.
Precipitation Anomaly October - May
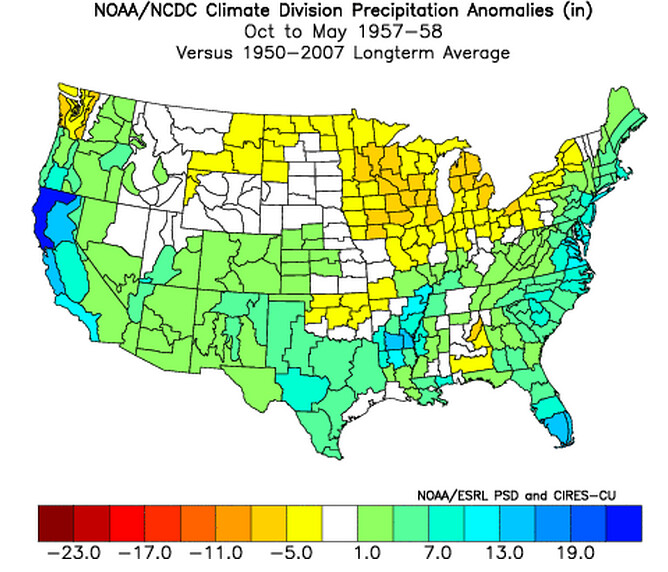
Yellows to reds mean drier than normal, while greens and blues mean wetter than normal. For this period, Colorado was slightly wetter than normal, as was most of the southern tier of the country.
1976-77
Sea Surface Temperature Anomalies October - May
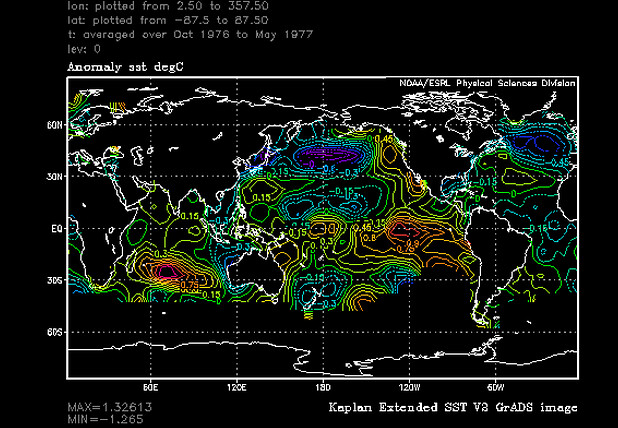
Same story here, with a very cold pool of water in the northwest Pacific Ocean and relatively warmer than normal water near the West Coast and in the ENSO region.
Temperature Anomaly October - May
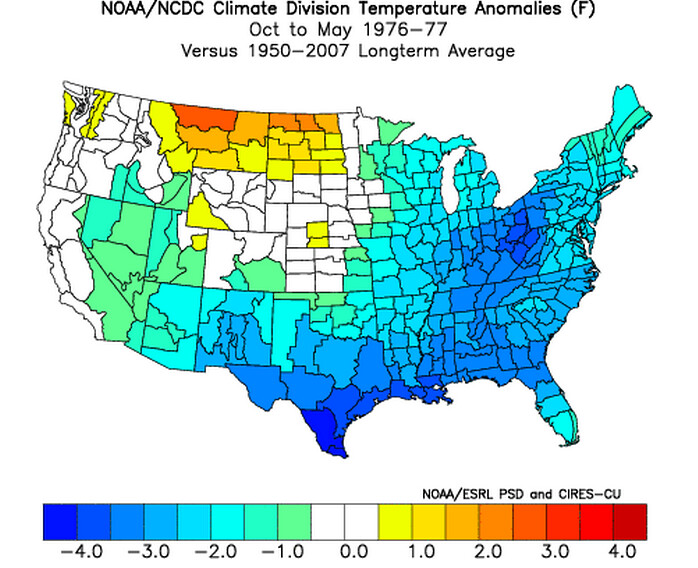
We see colder than normal for the southern and eastern tier of the country, with warmer than normal temperatures in the far Northern Rockies/Plains. This winter was legendary in the eastern part of the country due to how cold it was.
Precipitation Anomaly October - May
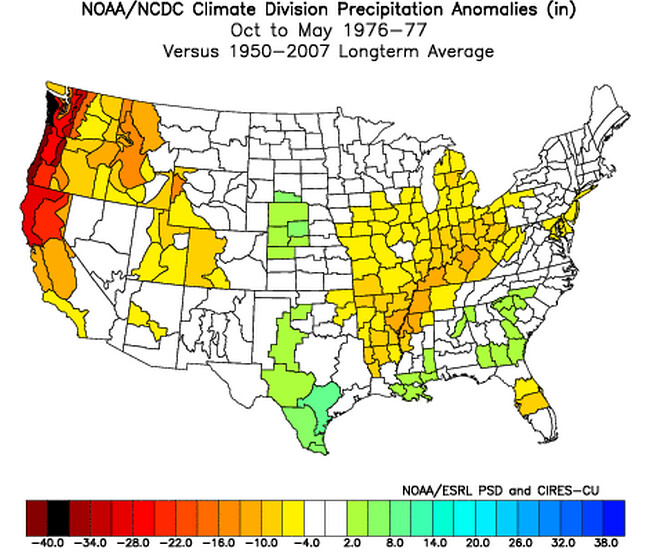
Above normal moisture was hard to find here. The west was dry, as was the Mississippi and Ohio Valleys. At least the eastern part of Colorado had normal moisture during this time, with above normal moisture in parts of the Nebraska and Texas.
1986-87
Sea Surface Temperature Anomalies
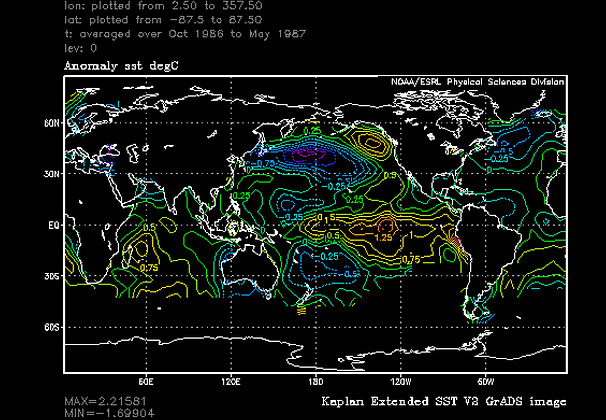
This is another year that looks very similar to what we are currently experiencing. However, the ENSO region was pretty warm in late 86 and 87, and I’m not sure we will see that strong of an El Niño. More on that later…
Temperature Anomaly October - May
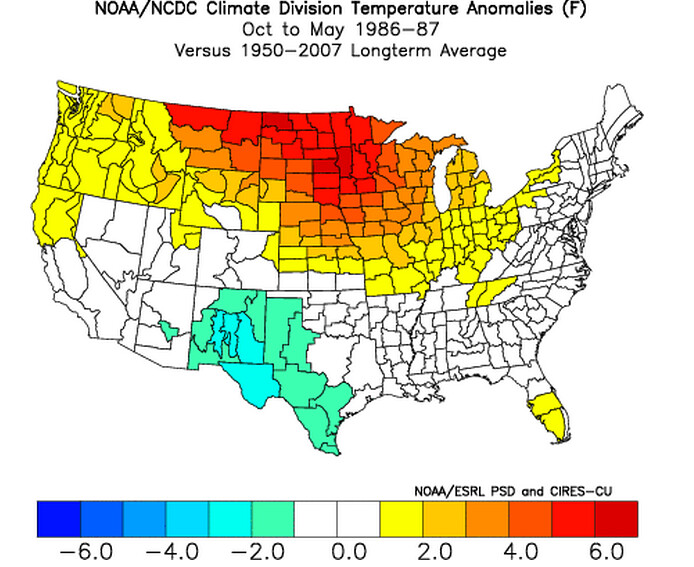
We see this analog year was quite warm in the northern tier of the country, with mostly normal temperatures for the rest of the country. The one exception was areas of west Texas and New Mexico.
Precipitation Anomaly October - May
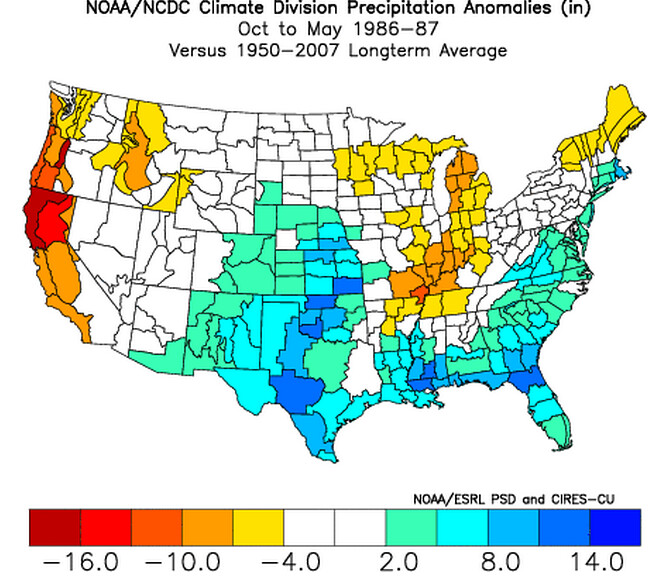
This is where the signal really shows up...Dry California, Great Lakes and Ohio Valley. Wet Colorado and most of the Plains states, eastward into the Southeast.
2002-03
Sea Surface Temperature Anomalies:
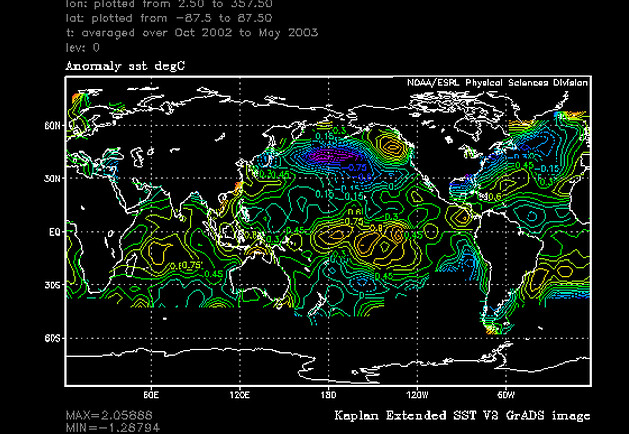
While a lot of the Pacific looks very similar to where we are and likely where we are heading, that warm pool just off the coast of Western Canada may be too warm. Otherwise, I really like this particular SST analog year.
Temperature Anomaly October - May
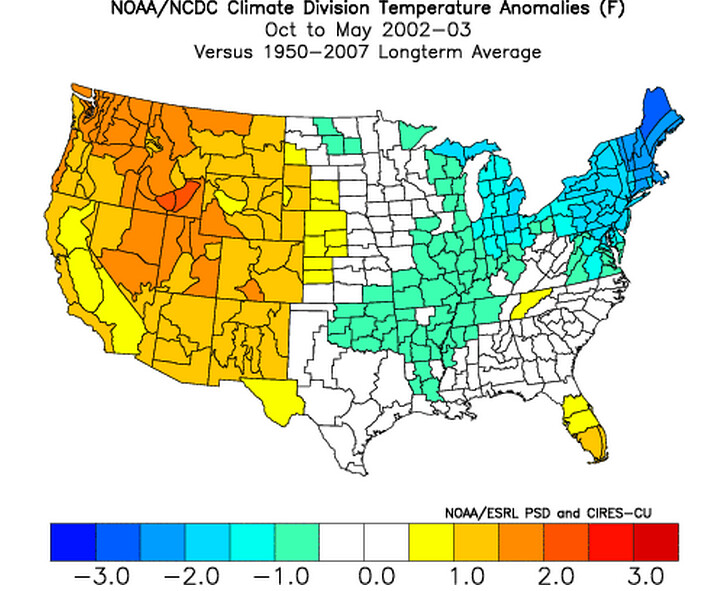
Precipitation Anomaly October - May
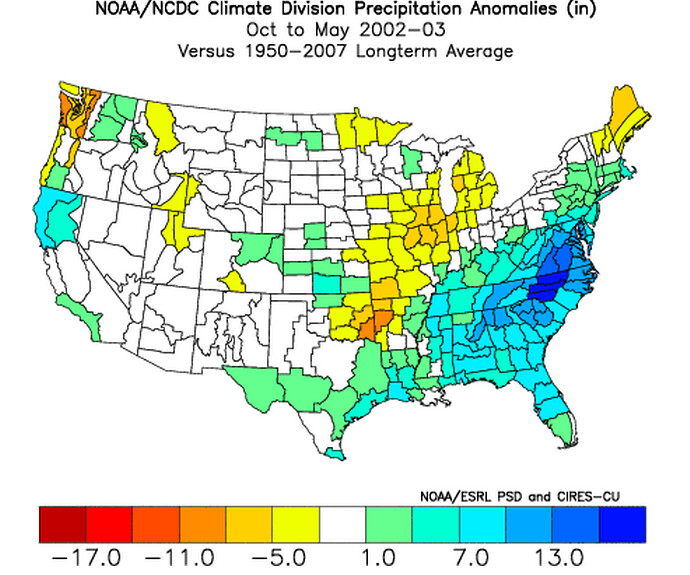
This year has a less clear cut signal unless you live in the far south and southeast. That slightly wetter than normal signal in the northern part of Colorado was largely due to the major blizzard in mid March 2003. Otherwise, the winter and early spring was quite dry. The lack of moisture for the whole state was largely made up in the spring.
2009-10
Sea Surface Temperature Anomalies:
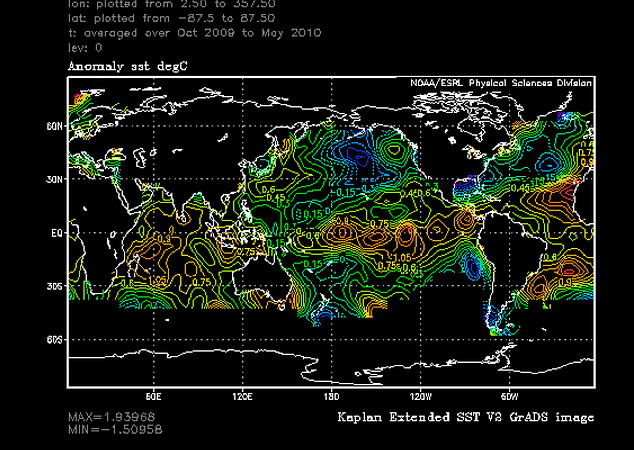
This analog used to be our favorite, but is now running behind a bit. The overall SST structure isn’t as good as the other analogs, but there are some signals that keep it intriguing. The less than warm North Pacific and a weak El Niño make it one that we have to give some weight…
Temperature Anomaly October - May
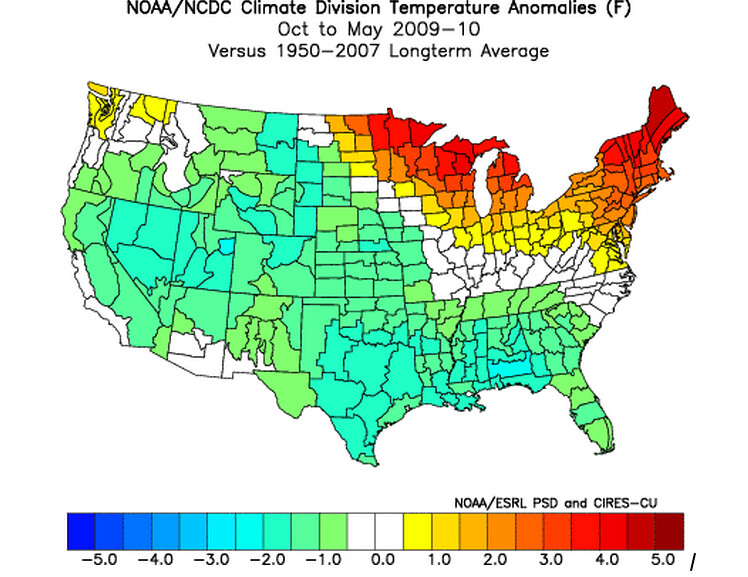
Almost the entire country was generally cooler than normal during this time. The obvious exception was the Great Lakes Region and The Northeast. Otherwise, this was one of the colder fall/winter periods in recent memory for folks in the Southern Plains and Southeast.
Precipitation Anomaly October - May
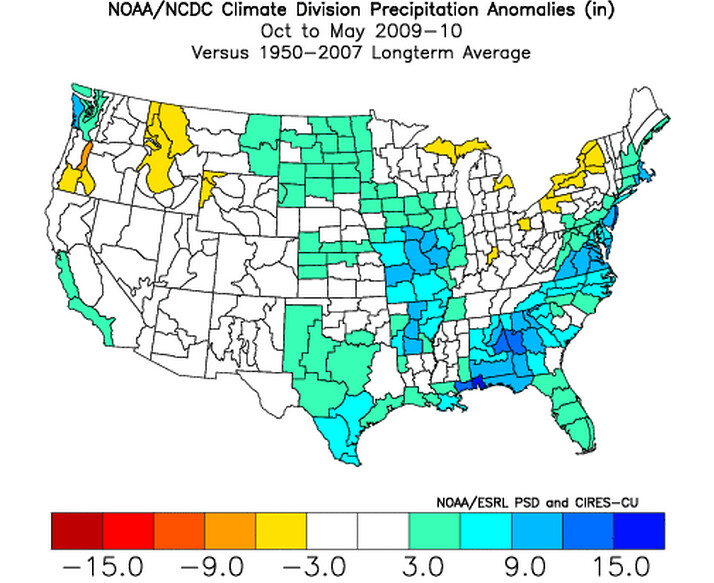
The wettest areas were the Western High Plains just east and southeast of Colorado, parts of the Mississippi Valley, and of course the Southeast. Colorado had decent moisture, but nothing excessive after a wet and cold fall.
Here is the composite analogs factoring in the years from above:
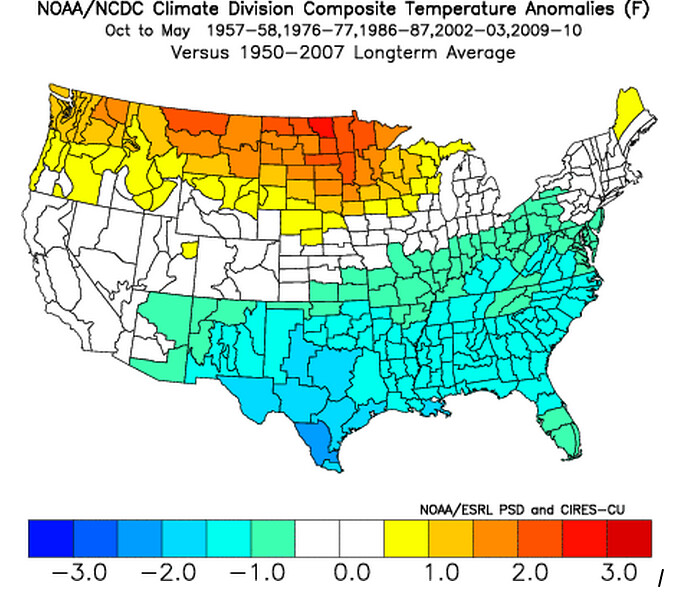
Temperature:
Precipitation:
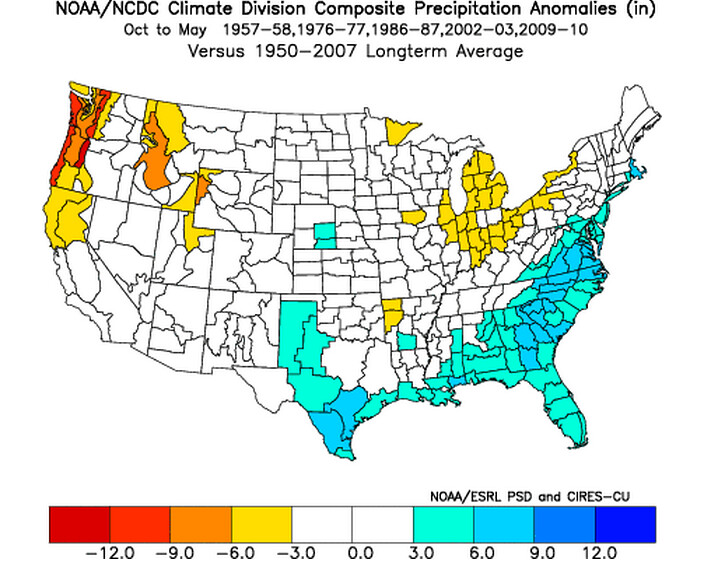
Overall, I think it is safe to say that our analogs produce cooler than normal weather in the south, warmer than normal weather in the north, and generally “normal” temperatures for Colorado. They also produce slightly wetter than normal weather in the South/Southeast, drier than normal weather in the Pacific Northwest and Great Lakes Region. Again, Colorado shows up as having “normal” precipitation. Do I think it will be like this? Not exactly. Whatever type of El Niño episode that develops will likely be weak. That means that some of the traditional signals will be a bit weaker, and possibly displaced. Coming up in a few days, I will post part two of this outlook, which focuses on model data and why I think that ONE particular model has a good handle on the overall forecast.