El Niño Update and CPC Constructed Analog Forecast

It's time for an update on our long-range outlook which now takes us through winter and on into spring. We'll tackle our thoughts around this upcoming snowfall season over a series of posts. Today we'll focus on the Climate Prediction Center's constructed analog forecasts, as we like the overall look of these forecasts as compared to our analog set. This will give us a nice launching point to dig deeper into the details over the coming weeks.
First, let's take a brief look at what this El Niño is up to:
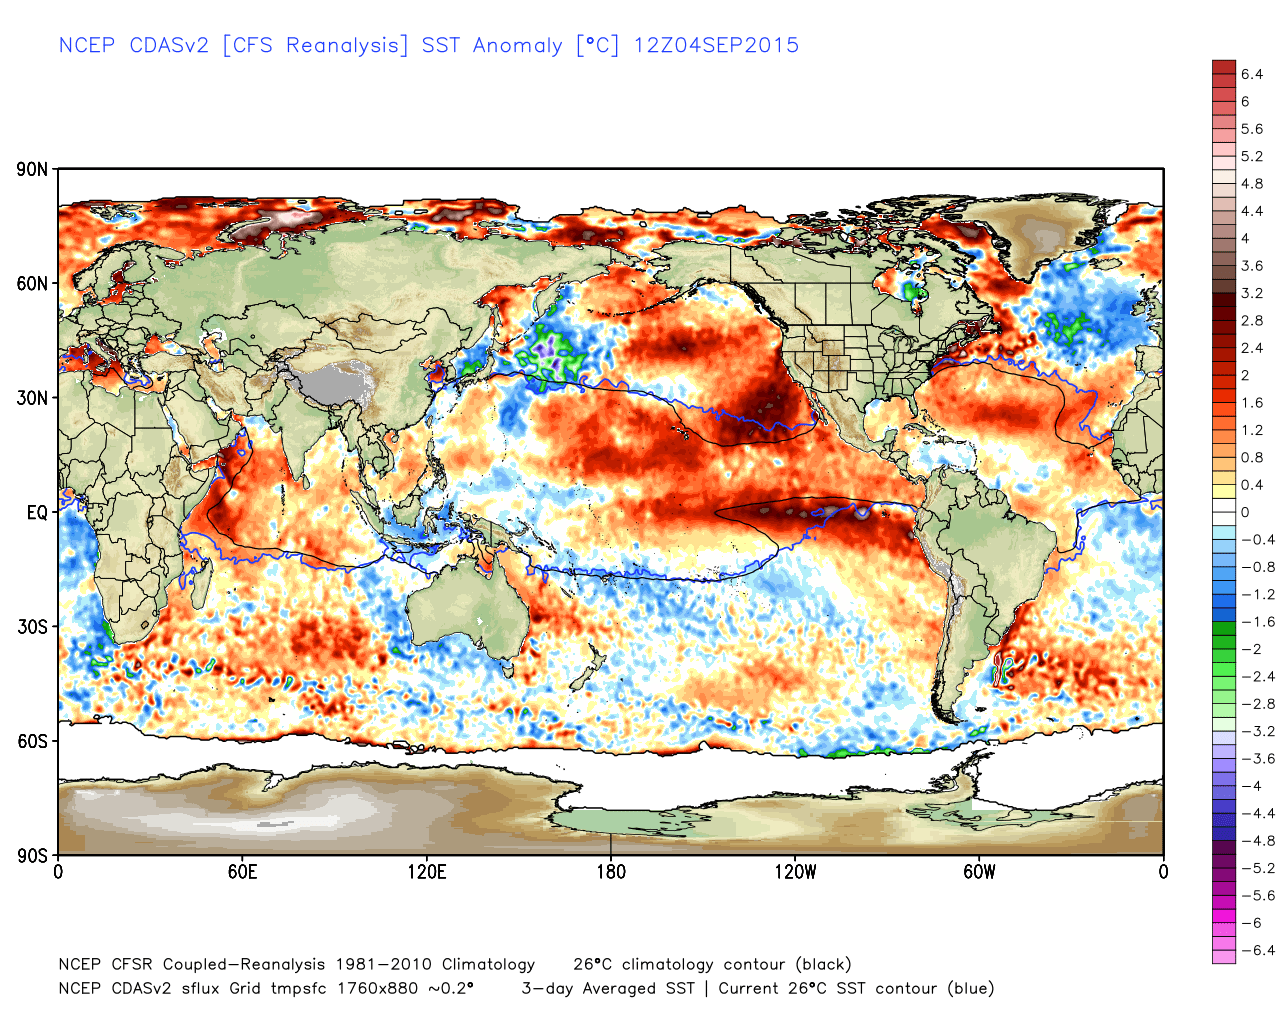
Yes, this event is a strong one. But has there been any change in the last few weeks?
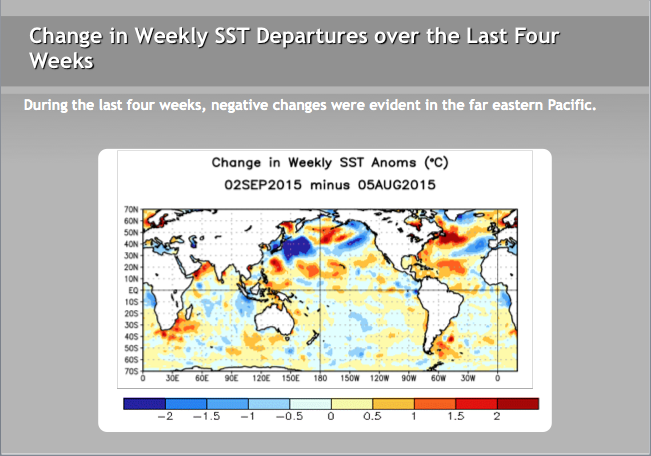
It looks like that ENSO Regions 1 & 2 just off the west coast of South America have cooled. Niño Regions 3 & 3.4, just west of 1 & 2 have warmed quite a bit. This should essentially seal the deal for what type of El Niño we will have:
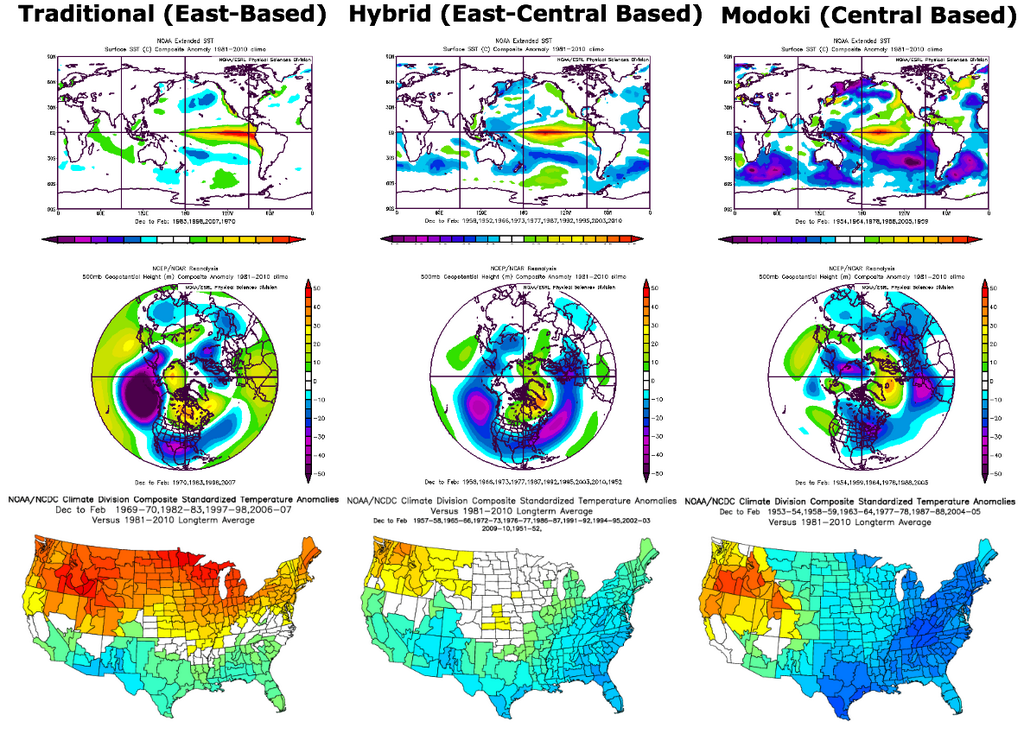
Being that the warmest water in all of the ENSO regions is shifting out of regions 1 & 2 and into 3 & 3.4, I think it is safe to say that a strong, hybrid, east-central Pacific based event is the way to go.
Side note: There has also been some cooling in the North Pacific, but it is still pretty toasty. Could this mean a cooling of the recently beastly (very warm) Pacific Decadal Oscillation? I am expecting the August PDO values to be a bit less than the July values. While the PDO isn't as warm/positive as it has been, it is still likely to stay warm/positive through at least early 2016. As we've mentioned before, what the PDO does over the next months remains key in what type of winter we can expect, it's not just about El Niño.
Constructed Analog Forecast
It has been a while since we've chatted about the analogs, and to begin the discussion this season I believe a primer is important. The primer I speak about is the Climate Prediction Center's Sea Surface Temperature Constructed Analog Forecast. The constructed analog forecast results from "combining past observed anomaly patterns in the predictor fields such that the combination is as close as possible to the base state." In other words, using the present to look into the past, to then go into the future. Some years more closely resemble the current sea surface temperature anomaly pattern, and are given a higher "weight" than others. It is through this weighting process that the forecast is constructed.
Rarely are we ever able to pluck an exact year from the past and say that the next set of seasons will mirror that favored year. I believe that statement to be no more true than what we have in front of us right now. We have discussed this at length here at Weather5280, and there really does not appear to be an ideal analog year for what is to come. I believe this particular El Niño is a rather odd fellow, especially in how it has evolved (strength/timing). That being said, we also believe that we have a pretty good idea how the fall/winter/spring seasons will pan out.
So while I will divulge our specific favorite analog years in a future post, here is a look at the Climate Prediction Center's Constructed Analog Forecast:
October, November, December:
The above map shows the expected upper level weather pattern. The red indicates "higher heights" in the atmosphere implying higher pressure, ridging, and warmer temperatures. The blue indicates "lower heights" in the atmosphere implying lower pressure, troughiness (storminess), and colder temperatures. You can see that the southeast 2/3 of the country is under the influence of a trough, while the western 1/3 is largely impacted by a ridge.
The temperature forecast above clearly show a colder than normal signal for the eastern 2/3 of the country, largely due to the persistent trough. Farther west, not so much.
The wetter than normal signal is right where it should be: aligned with the upper level trough, which keeps the southeast 2/3 of the country wetter than normal. Meanwhile, far northern California and the Pacific Northwest are drier than normal, under the ridging. For Colorado, temperatures are near normal west and below normal east. Precipitation is near normal west and northwest, and slightly above normal south/southeast. Under this scenario, the farther south/east you live the better chance you have of seeing colder and wetter than normal conditions for October, November, and December. Make sense?
December, January, February:
For the core winter months, the constructed analog has a HUGE trough of low pressure in the North Pacific and Gulf of Alaska (Aleutian Low). This is a very classic pattern during a strong El Niño. Another classic feature of a strong El Niño is a strong subtropical jet stream that impacts the southern tier of the country. That also shows up nicely, with all the "blue shading" over the southern/southeastern part of the US. From what we know, this pattern should keep the west and south rather stormy, with less storminess farther north. We'll see...
The temperature forecast above shows it to be much colder than normal for the southern/southeastern parts of the country, with warmer than normal temperatures likely for the most of the West, Northern Rockies, Northern Plains, and Western Great Lakes.
The precipitation forecast is about what we would expect too. Wet for most of California, the Southern Rockies/Southern Plains, Gulf Coast, and Mid Atlantic.
For Colorado, the far southern/southeastern parts of the state would be colder than normal, with above normal temperatures likely for western/northwestern parts of the state. Wetter than normal conditions would ONLY favor the far southern parts of Colorado... essentially south of HWY 50.
February, March, April:
Notice that the same upper level pattern that is forecast to prevail in December, January, and February, is forecast to occur in February, March, and April. Despite what will likely be a rapidly weakening El Niño by late winter and spring, the same weather pattern persists.
The same temperature pattern is persisting too... warmer the farther northwest you live and colder the farther southeast you live.
However, the precipitation forecast calls for slightly above normal moisture for areas a bit farther north. This is due to the storm track shifting northward from its very southern location.
For Colorado, the far southern/southeastern parts of the state would be colder than normal, with above normal temperatures likely for western/northwestern parts of the state. Most of the state should see normal to slightly wetter than normal conditions. Obviously, the farther south you live in Colorado, the better chance you have of getting above normal moisture.
Key takeaways
This should raise a red flag to many that have been following the El Niño hype. Why? Because I have seen a lot of press suggest that all of Colorado is going to have a very cold and snowy winter. Typically with the stronger El Niño events, the only part of the state to really see consistently above normal moisture for the whole winter is the far southern part. This is due to the main storm track getting shoved farther south. For northern areas, a strong El Niño can many times imply warmer than normal temperatures and pretty dry conditions during the core winter months.
Related: A Closer look at What El Niño Means for Rain and Snow in Colorado
This obviously hurts the central and northern mountains and subsequent ski resorts that reside in those mountains. Resorts that are farther south typically will do much better. Does that mean that Denver won't see any snow? No, absolutely not. It just means that the majority of that snow may occur early (fall and early winter) and late (late winter and spring). In fact, an average of our analog years (below) equates to above average snowfall for the city.
Keep in mind, these constructed analogs are not our official forecast. However, we found that they closely mirror many of our individual analog years so thought they were worth sharing. I will break down our individual analog years in a series of future posts, but here they are in chronological (not favored) order: 1940-41, 1941-42, 1957-58, 1958-59, 1972-73, 1991-92, 1997-98, 2002-03, 2009-10, 2014-15. Others that deserve some weight and attention: 1877-78, 1887-88, 1930-31, 1982-83, 1986-87. Old and questionable data (1800s events and 1930-31) along with some of those events not being strong enough (1930-31 and 1986-87) preclude them from being included in our analog set. Feel free to browse the web for details about those years, but keep this in mind: every El Niño is different and there are many other forecast drivers that play a big role. All we aim to do is get an accurate idea of how the next several months will play out. In that, our goal is to share that idea with you so you can plan accordingly.
More to come in the weeks that follow, subscribe to Weather5280 for updates!