Analyzing Colorado's precipitation trends over the last 125 years

Precipitation totals over the past 125 years haven't changed much for Colorado on the whole, however, county-level data reveal notable trends between months and seasons.
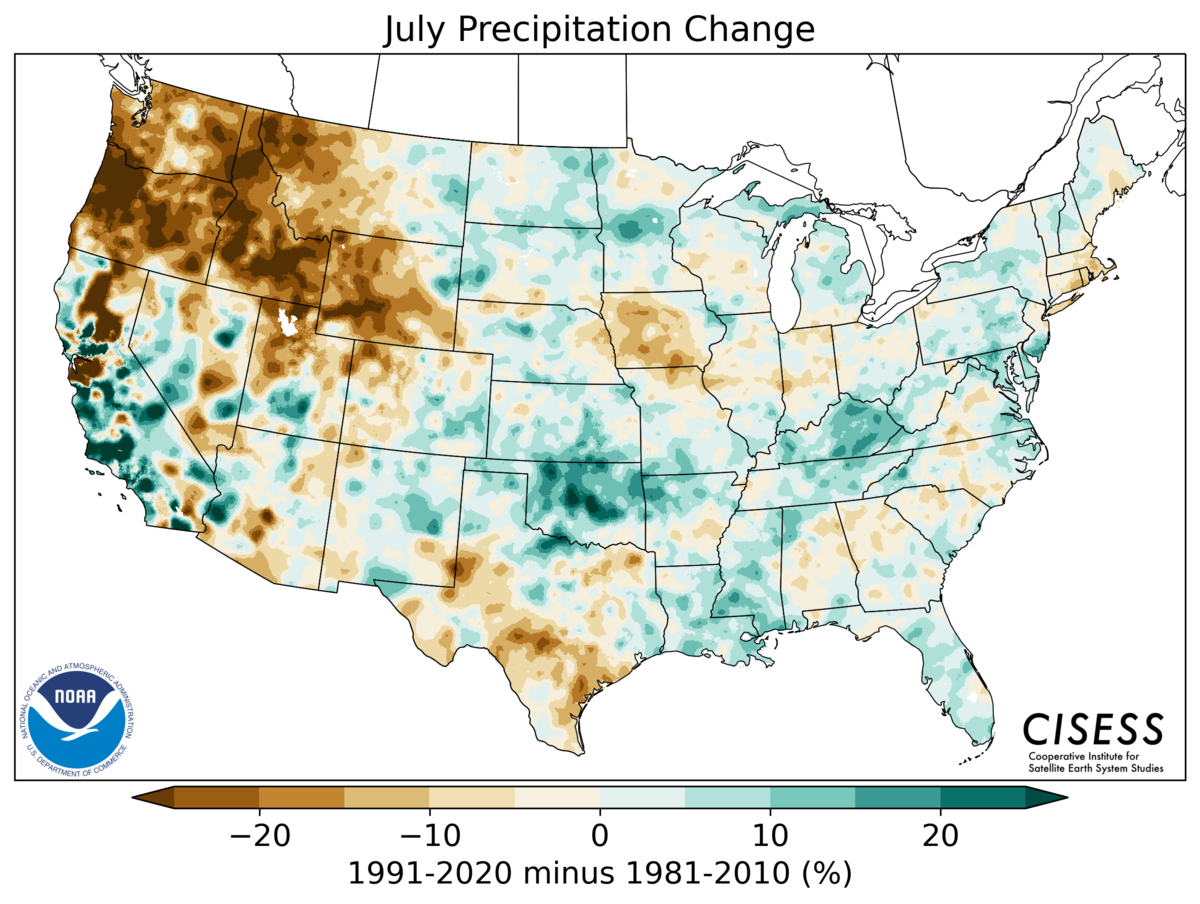
Similar analyses have been done on a national level, and those studies also point to precipitation variability and shifts across the Lower 48. These studies have different processes and utilize different datasets, but the outcomes are rather similar amongst various methodologies.
In my methodology, I take a simplistic approach: I take the county-specific nCLIMGRID data from the NCDC - from 1895 through 2020 - and apply a simple linear regression to identify trends in precipitation for that period of record.
When I process the data for the U.S., my findings are similar to that of the more complex studies for the lower 48.
My interest for this post is to show Colorado's trends over the decades. With that said, here we go.
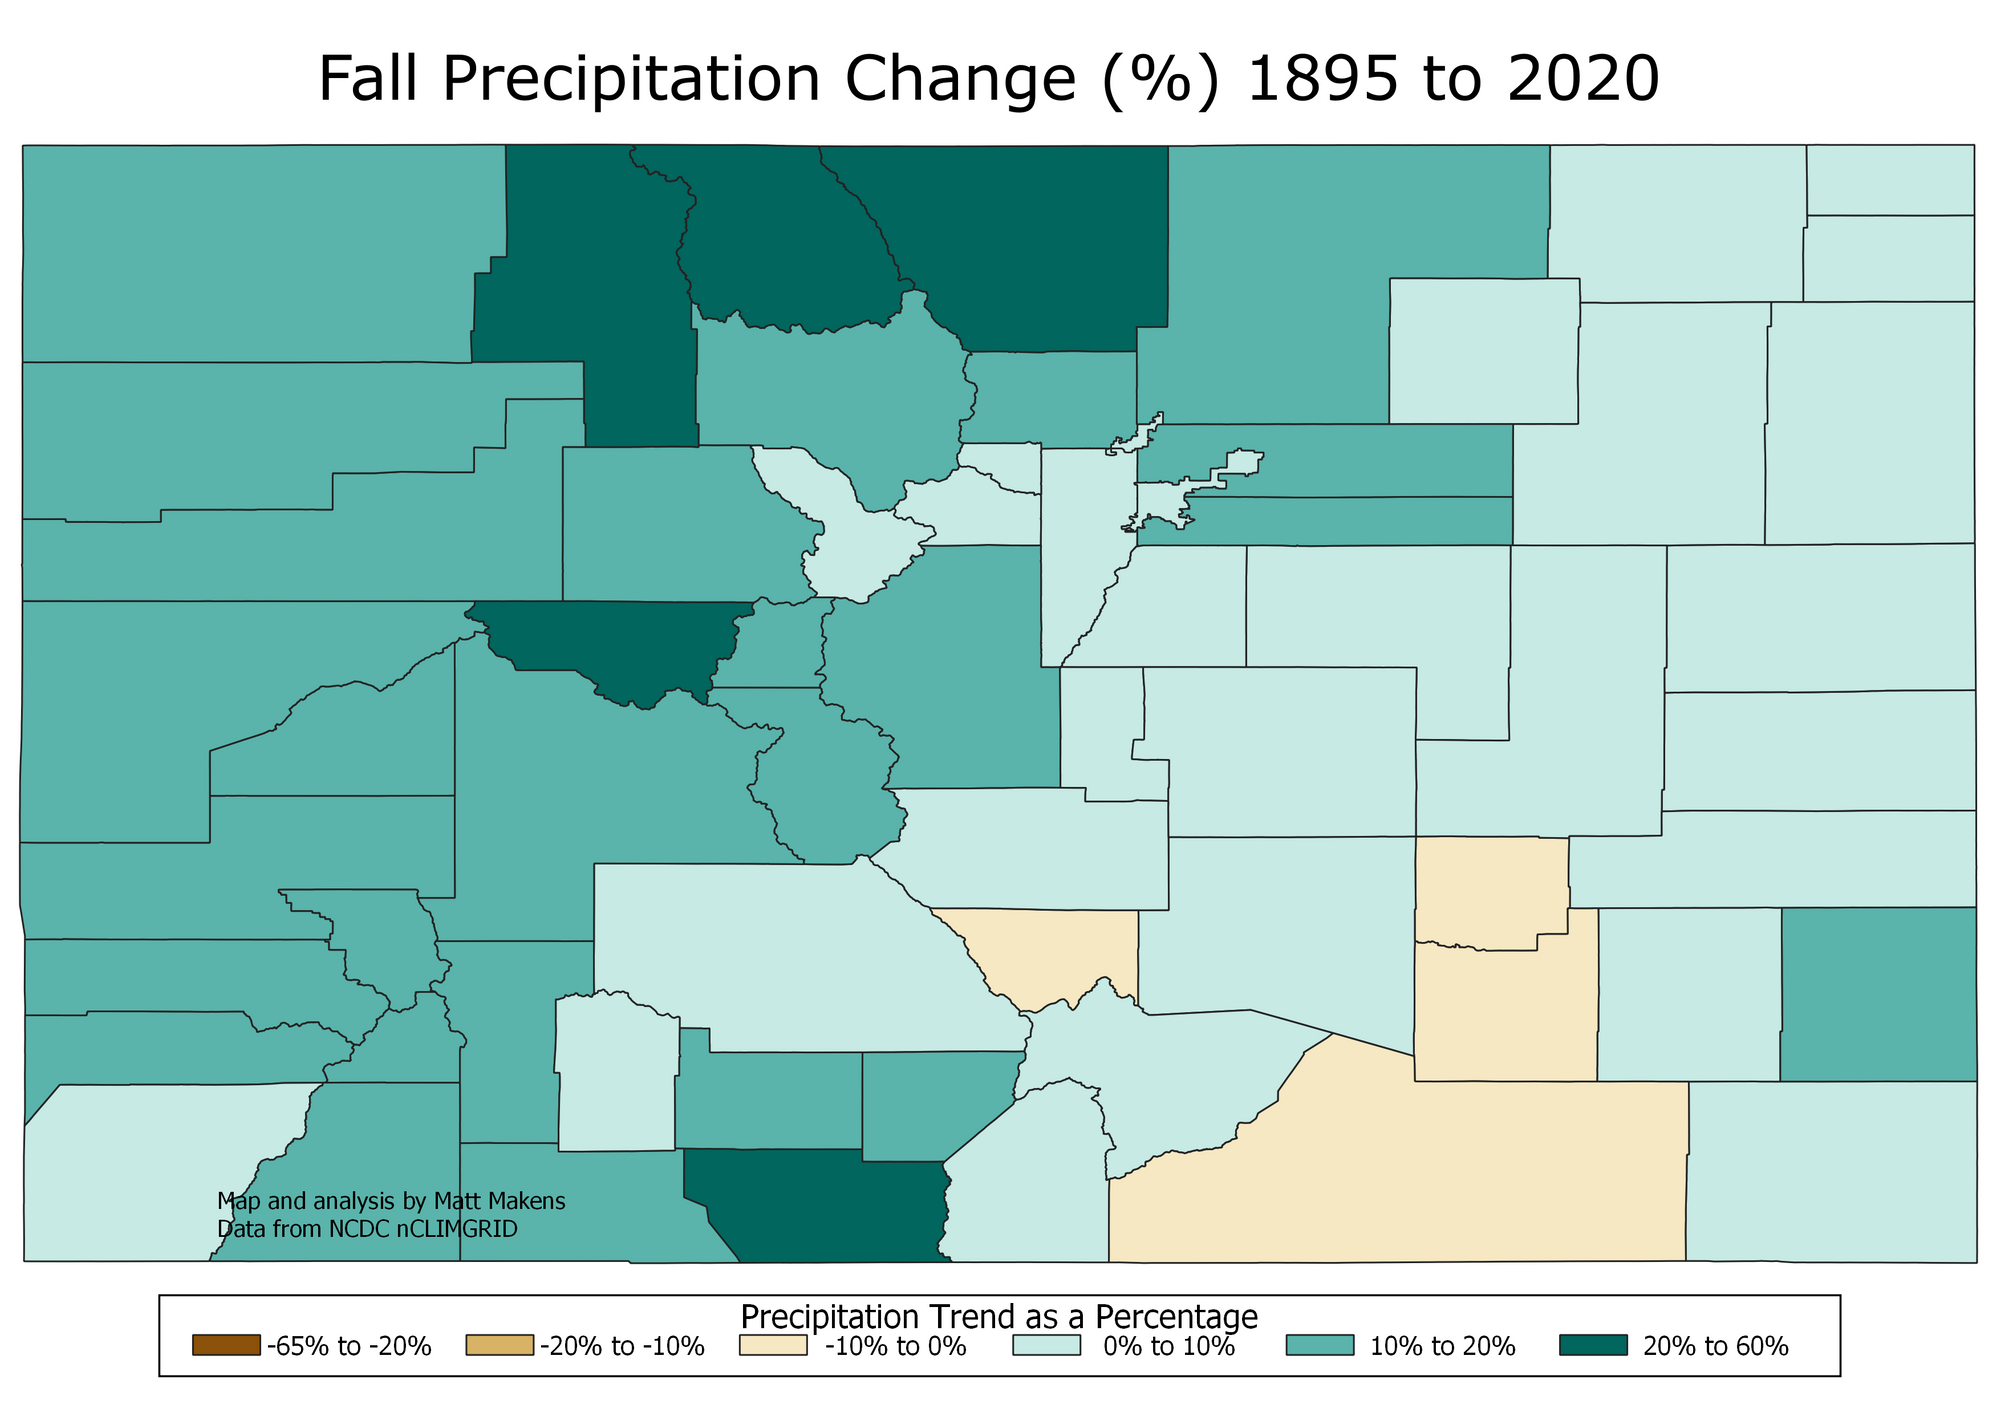
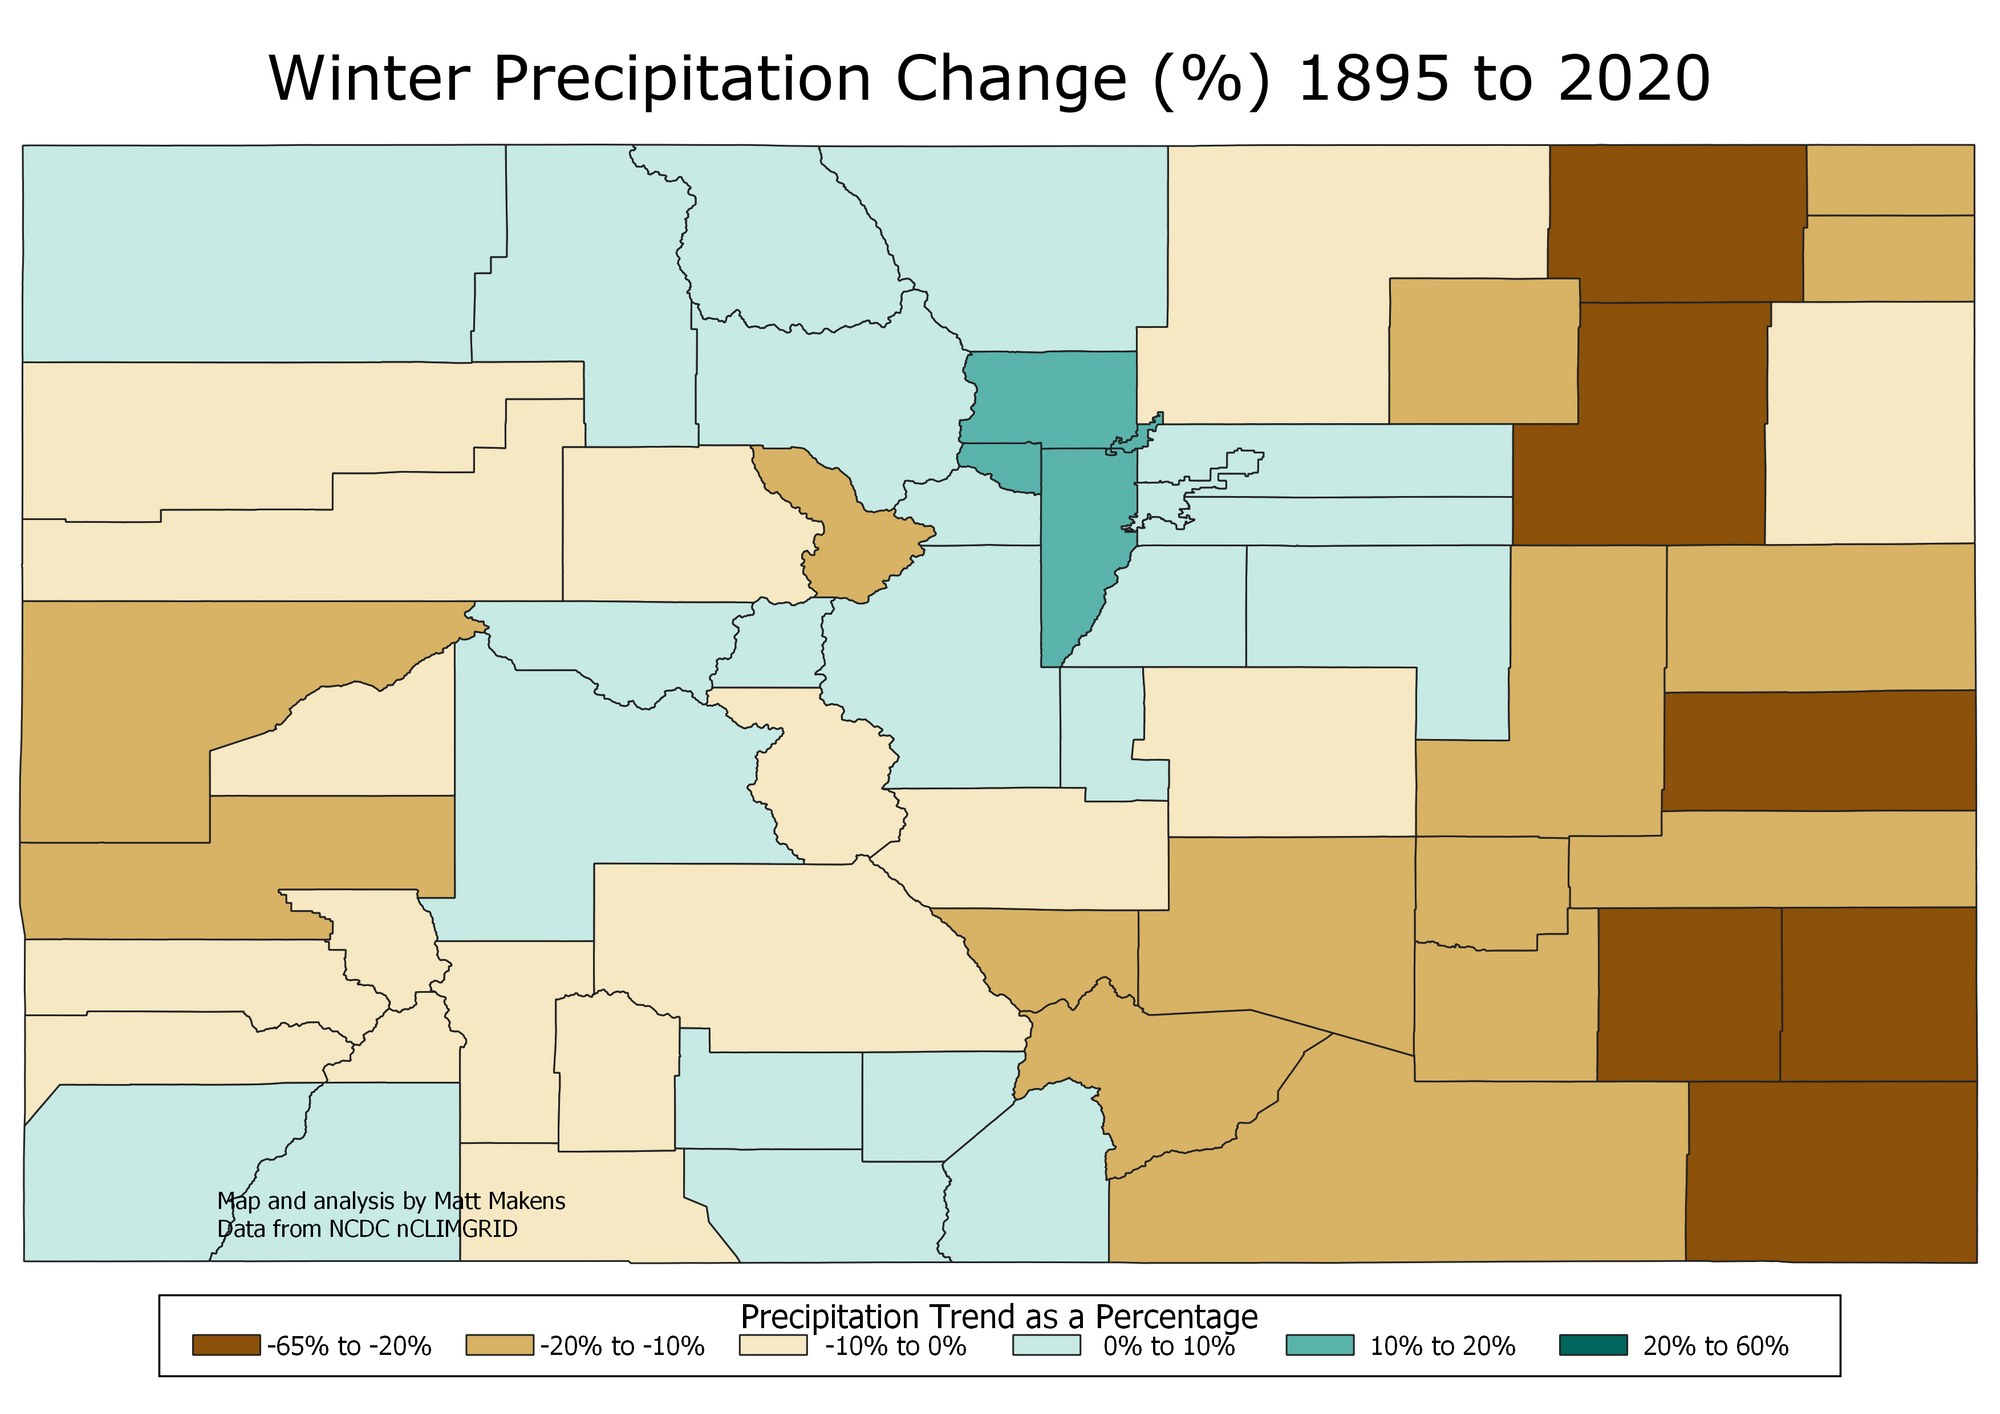
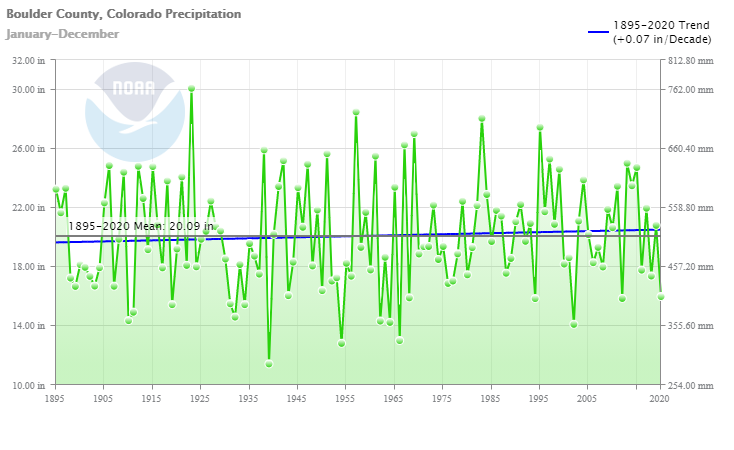
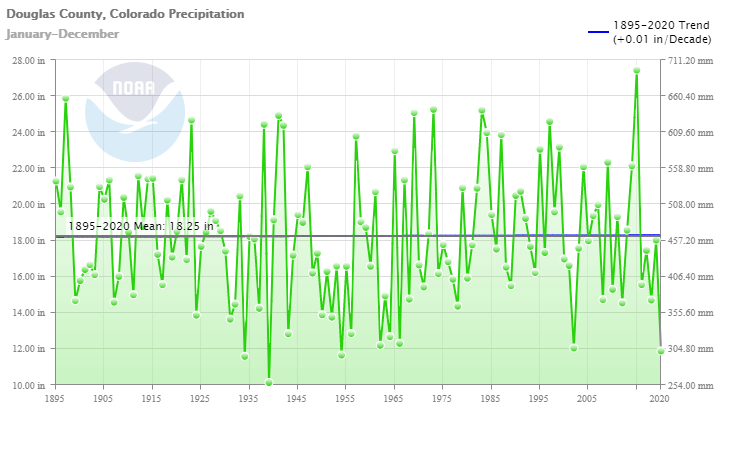
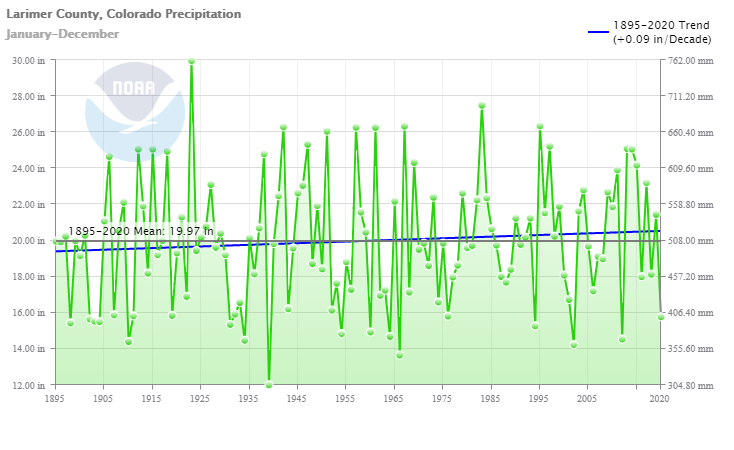
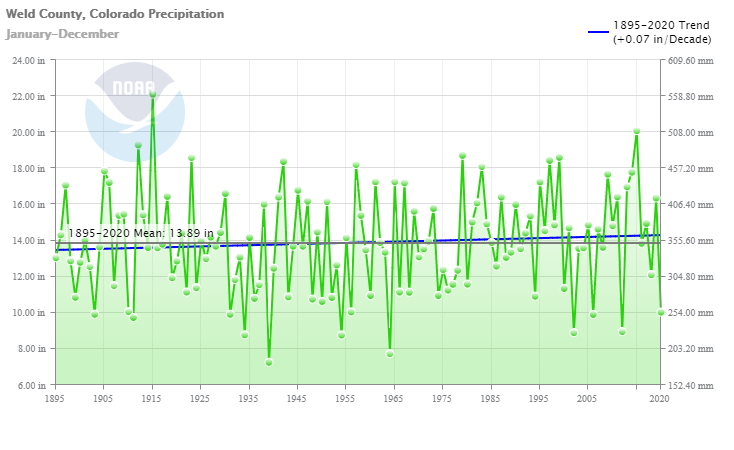
Before we get to specific monthly trends, annually and seasonally we see notable wetter and drier trends. The following five images are a precipitation trend shown as a percentage for 1895 to 2020.
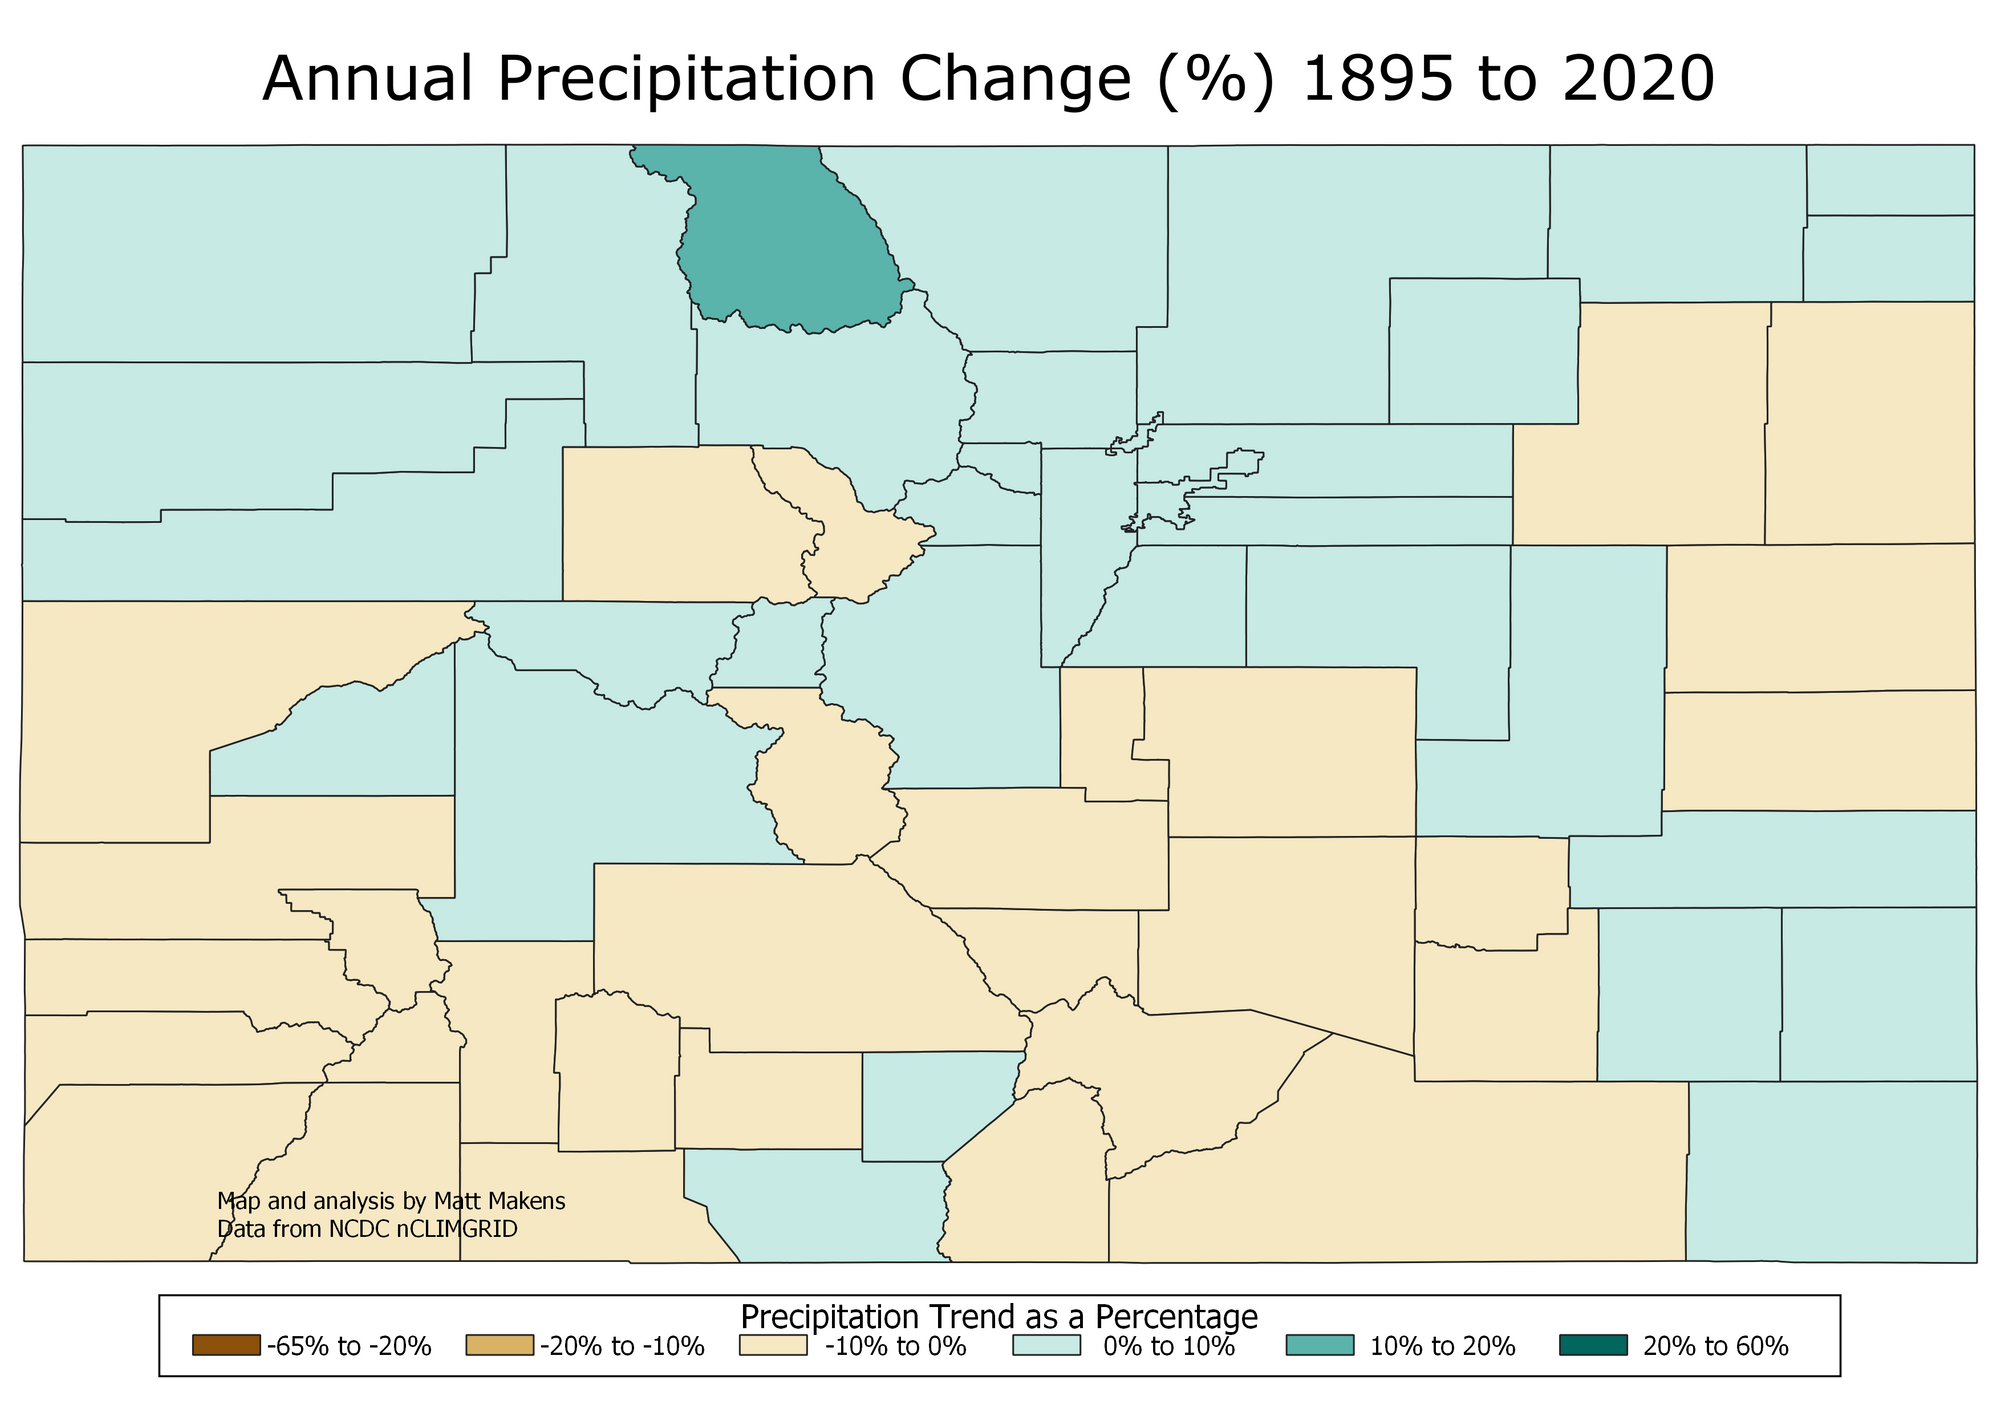
Annual trends suggest a northward shift in precipitation. Northern Colorado counties have trended wetter as opposed to most of Southern Colorado counties.
Let's look at trends for each season.
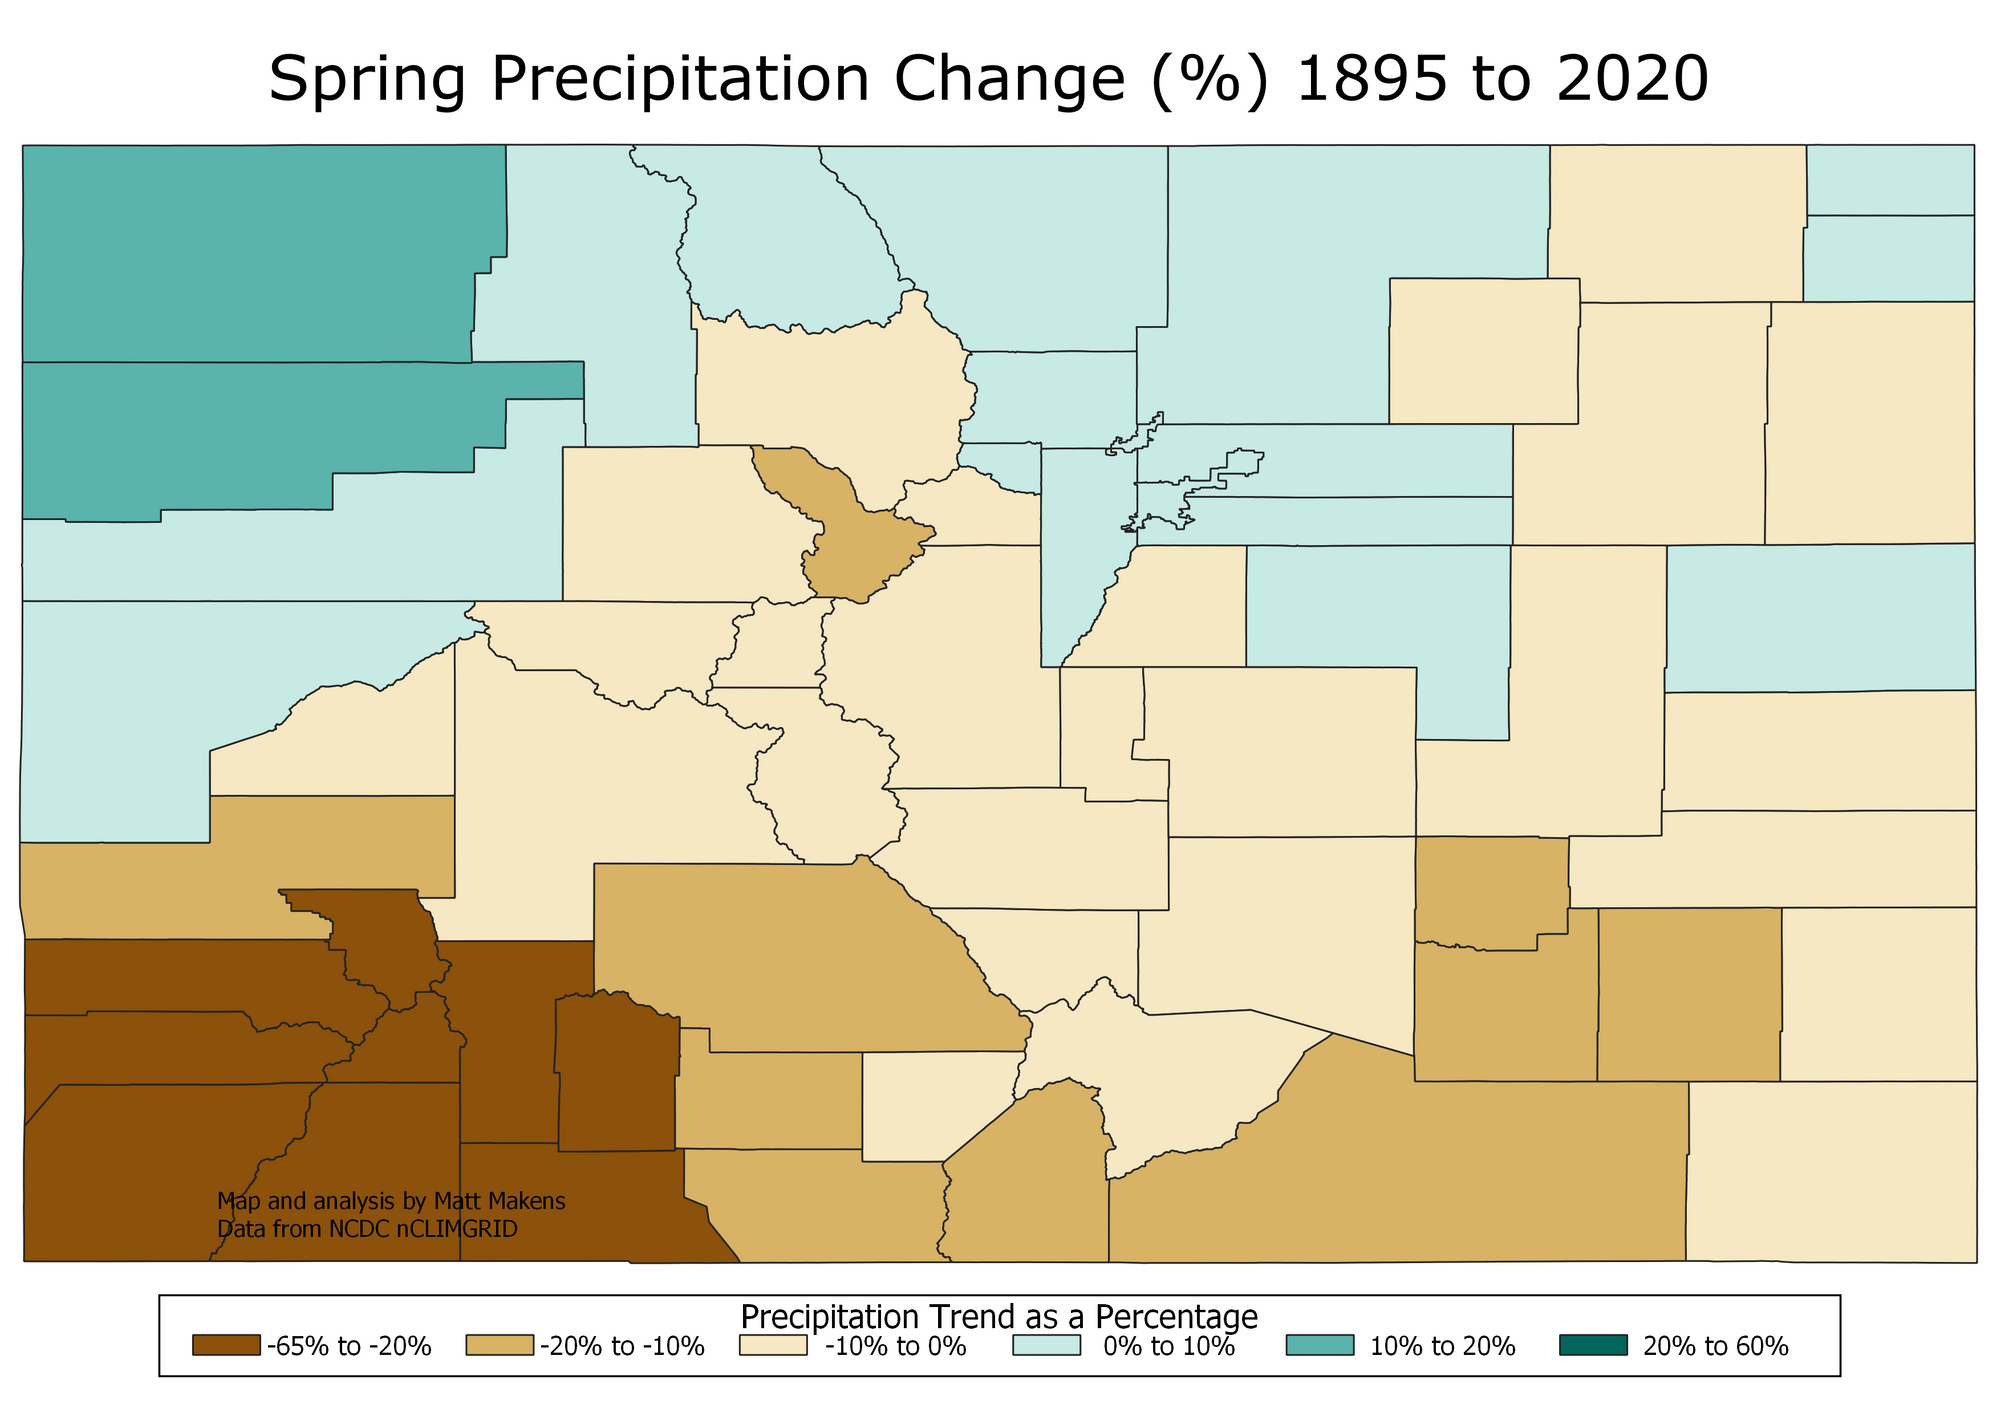
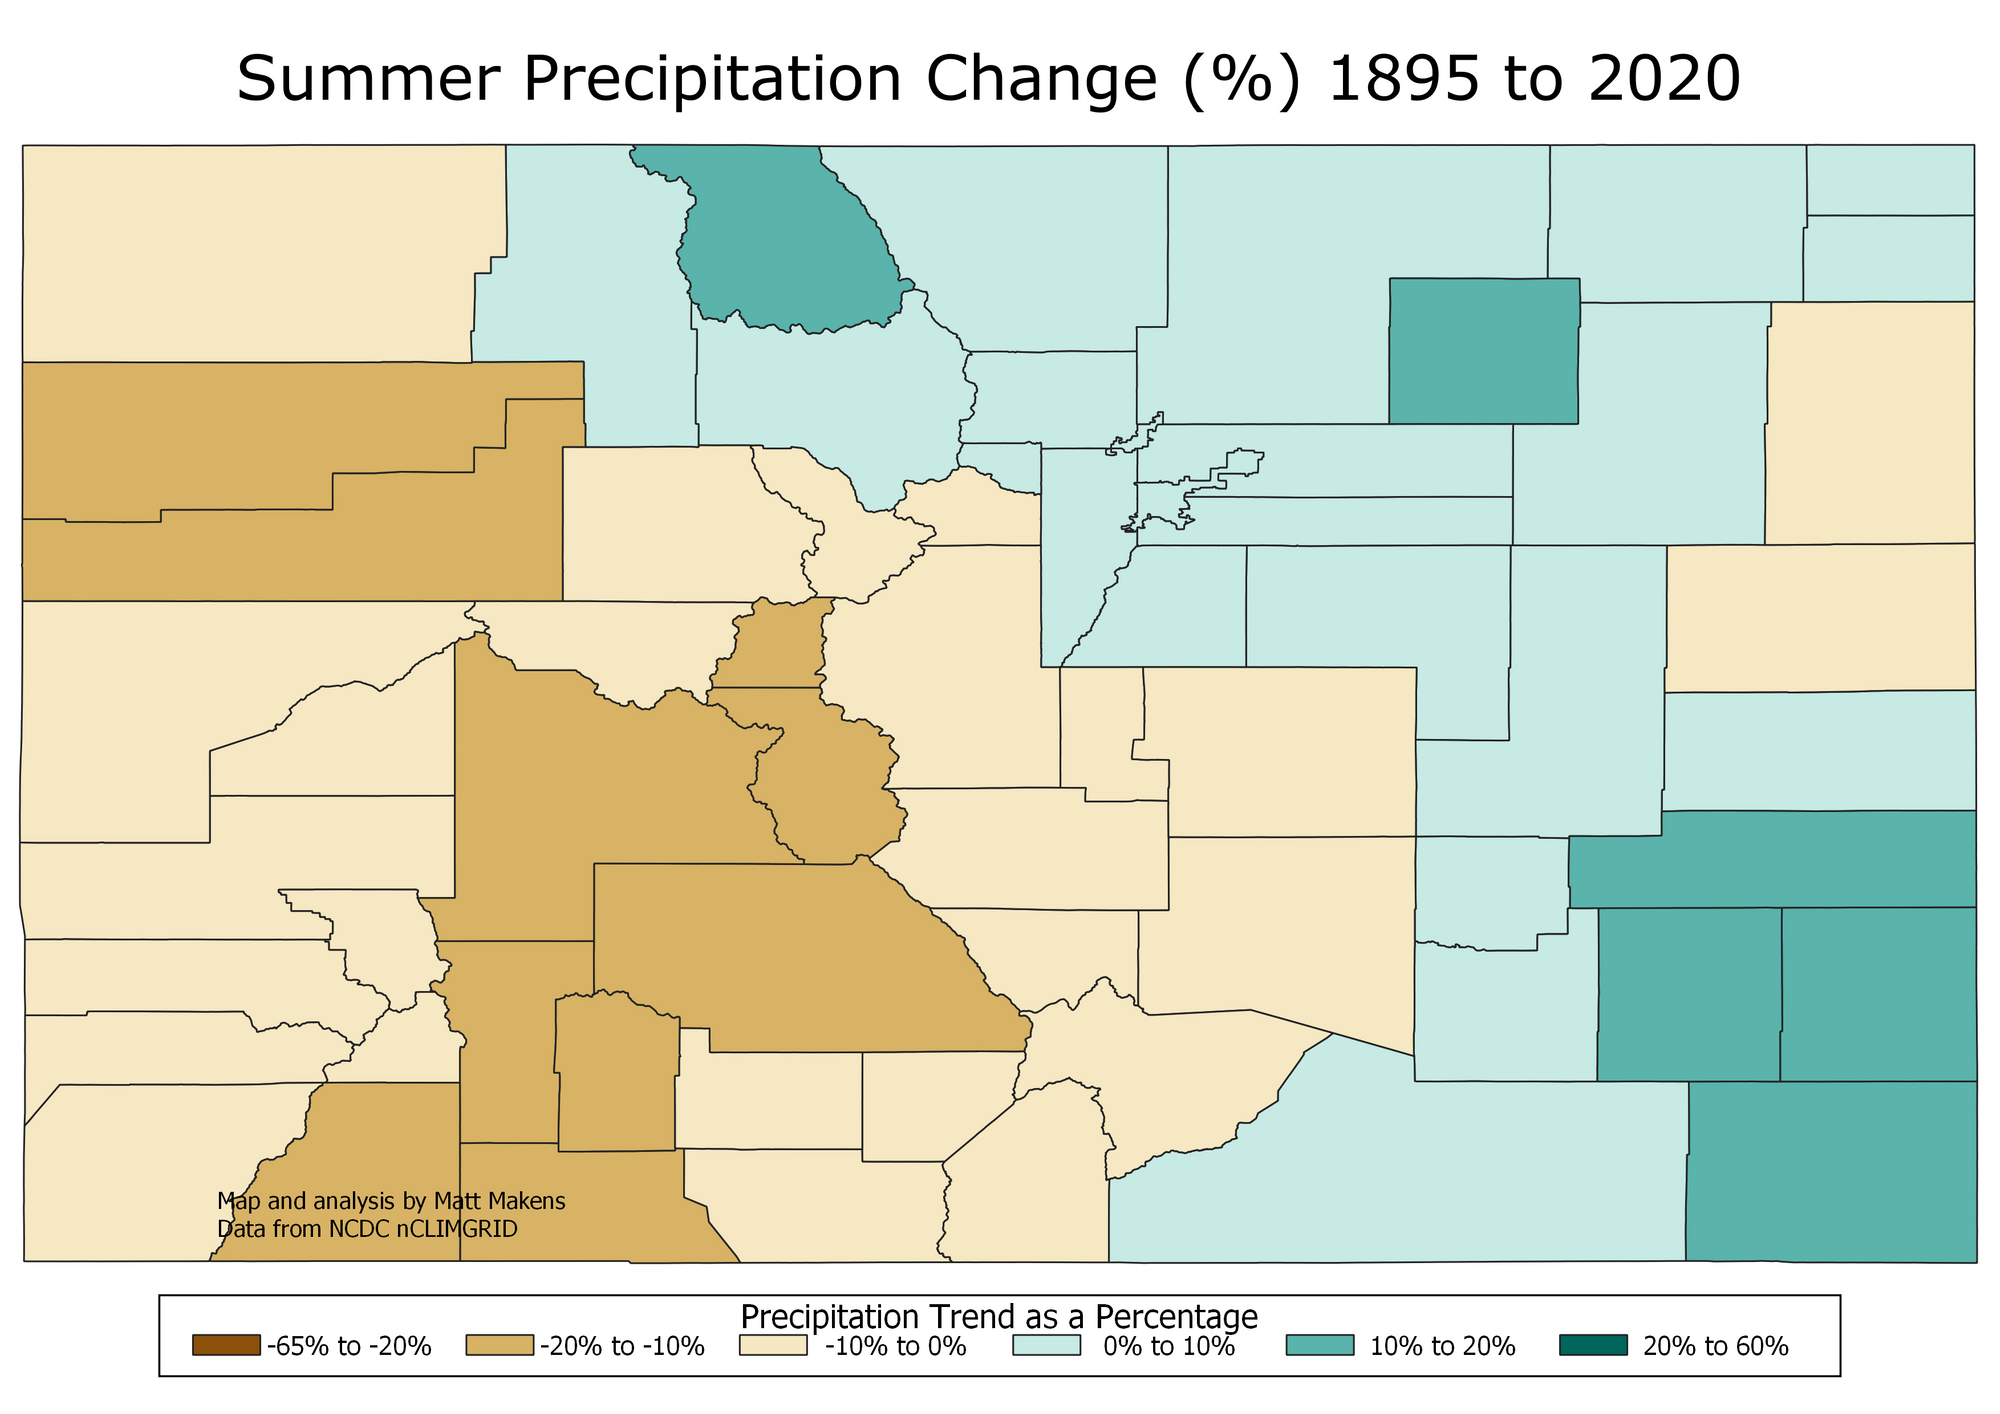
Spring shows a notably drier trend for Southwest Colorado counties.
Fall trends toward wetter conditions across Northern Colorado counties.
Winter's trend shows increased wetness for the west metro counties: Boulder, Jefferson and Clear Creek Counties. Meanwhile, the plains trend drier.
This is probably a good moment to note there have been some significant precipitation events that should be considered while looking at the trends. In a more comprehensive study, on my to-do list, I will remove the extreme outlier events...
After I completed the seasonal analysis, I was curious how months have trended.
Here we go, monthly trend analyses with the trend of precipitation in inches:
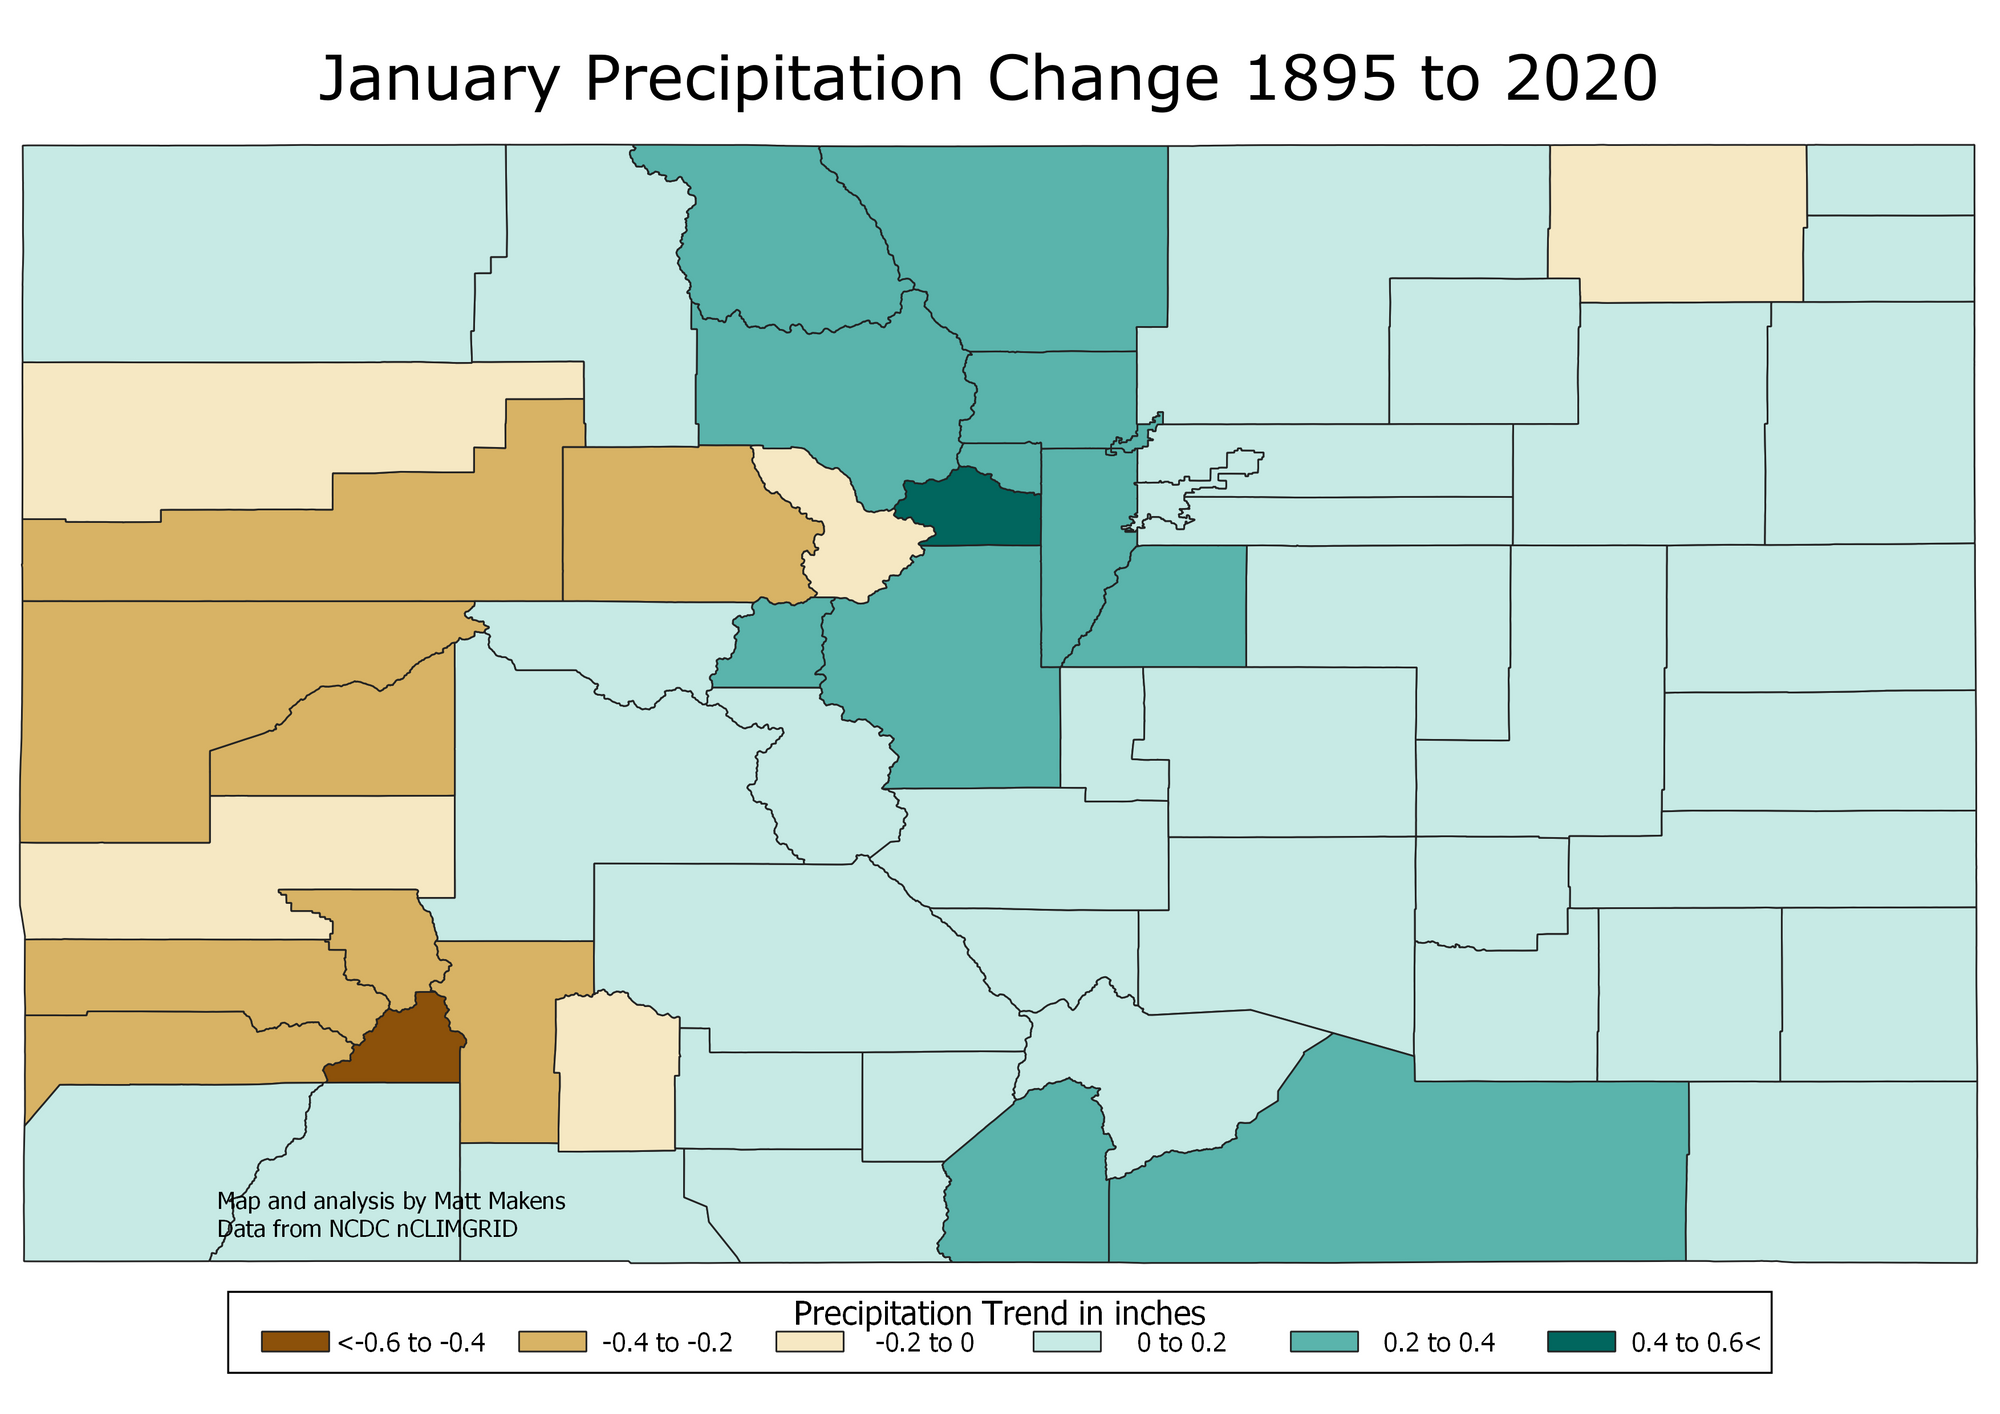
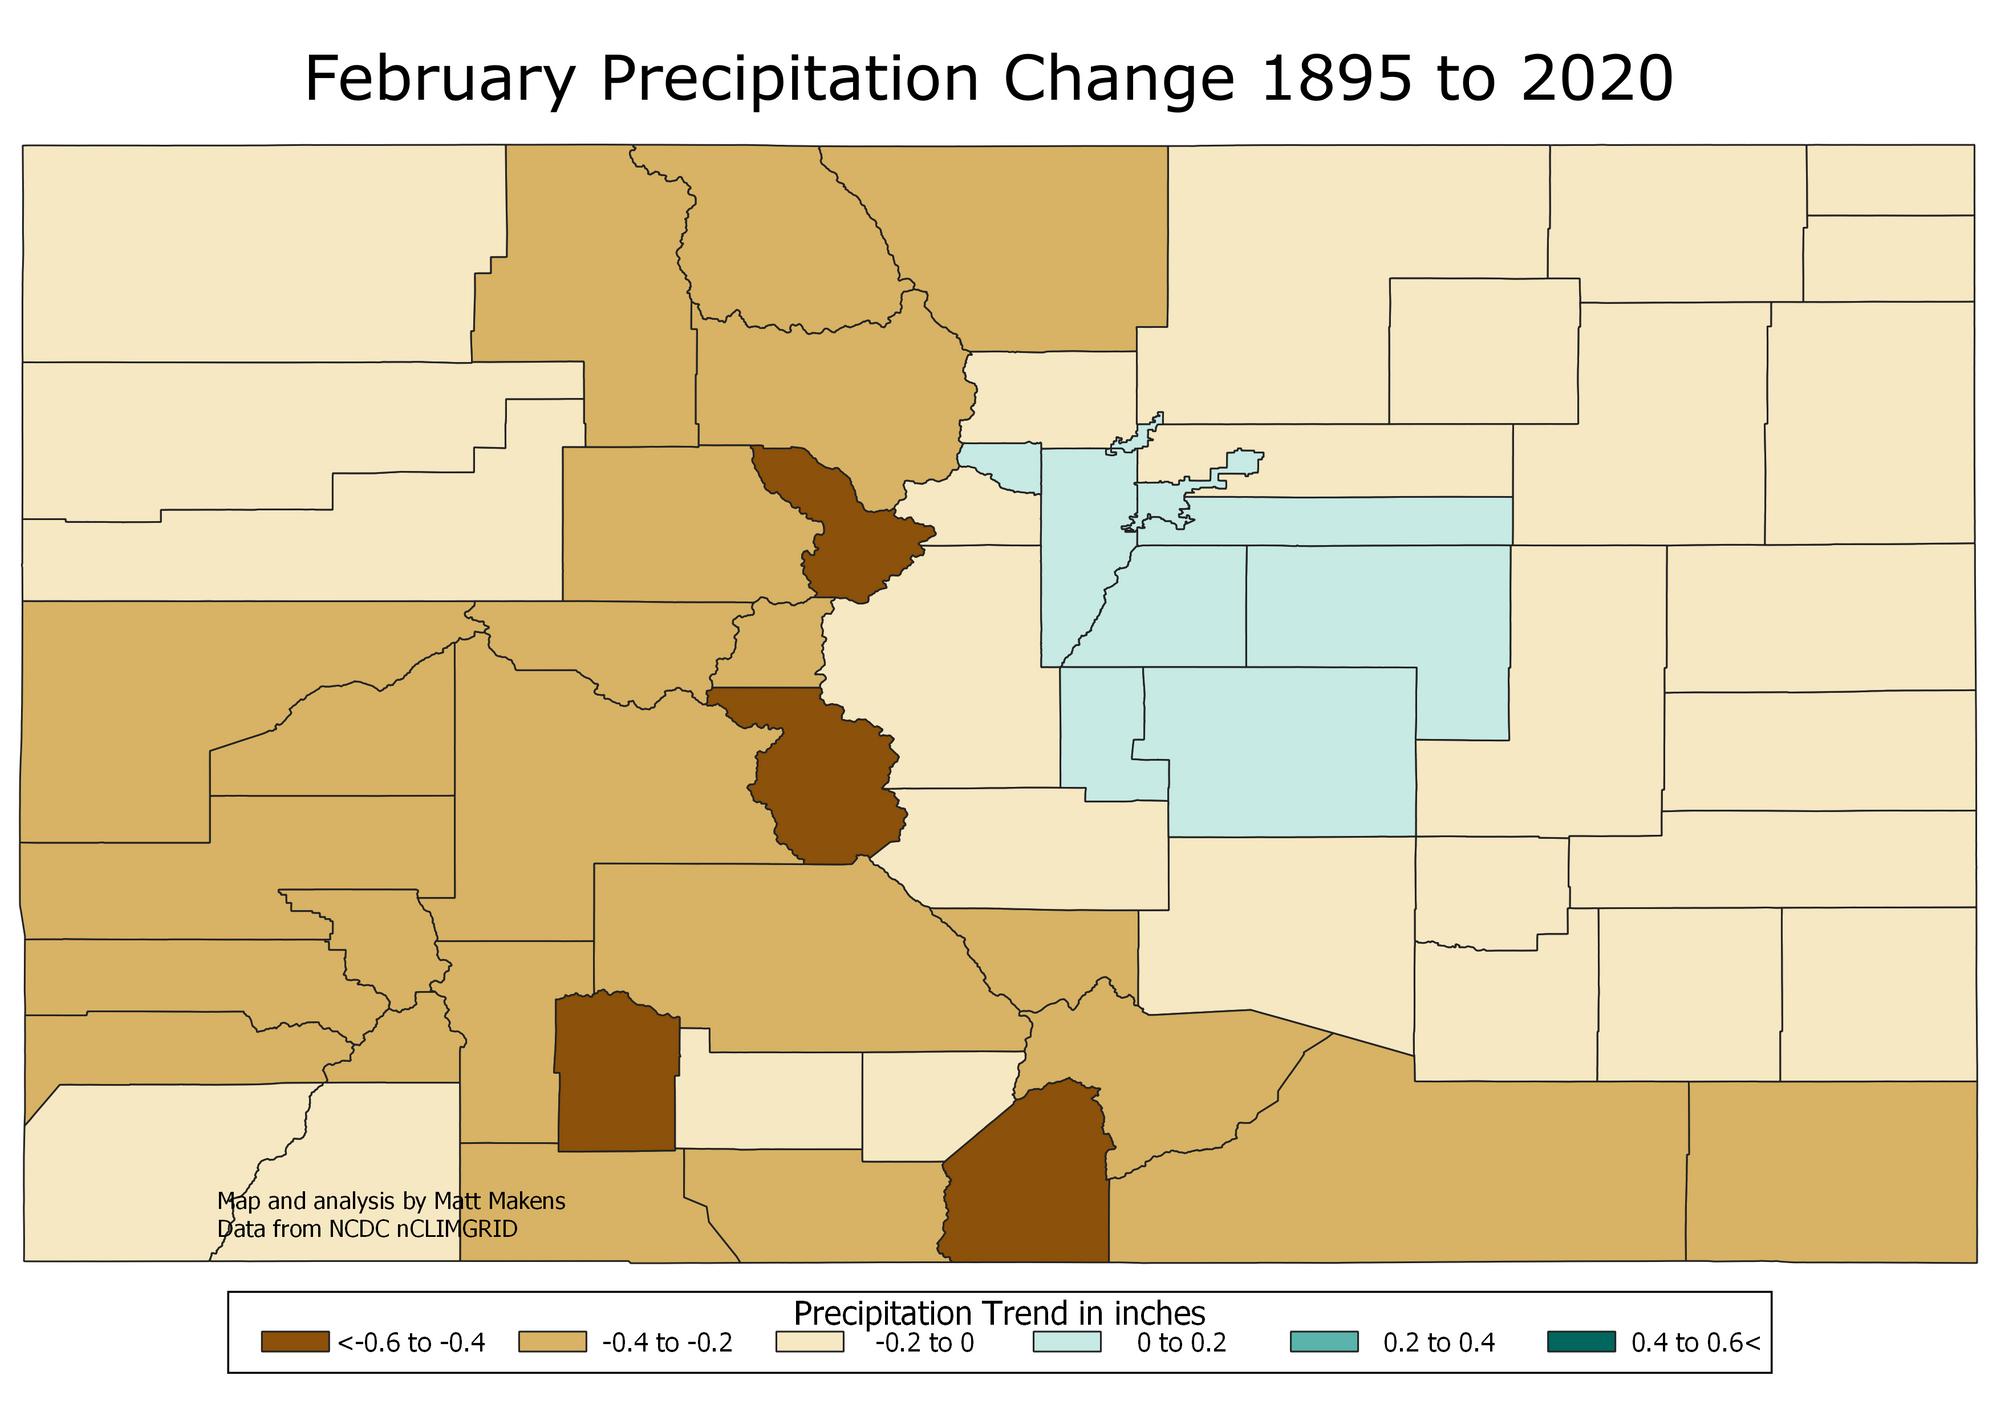
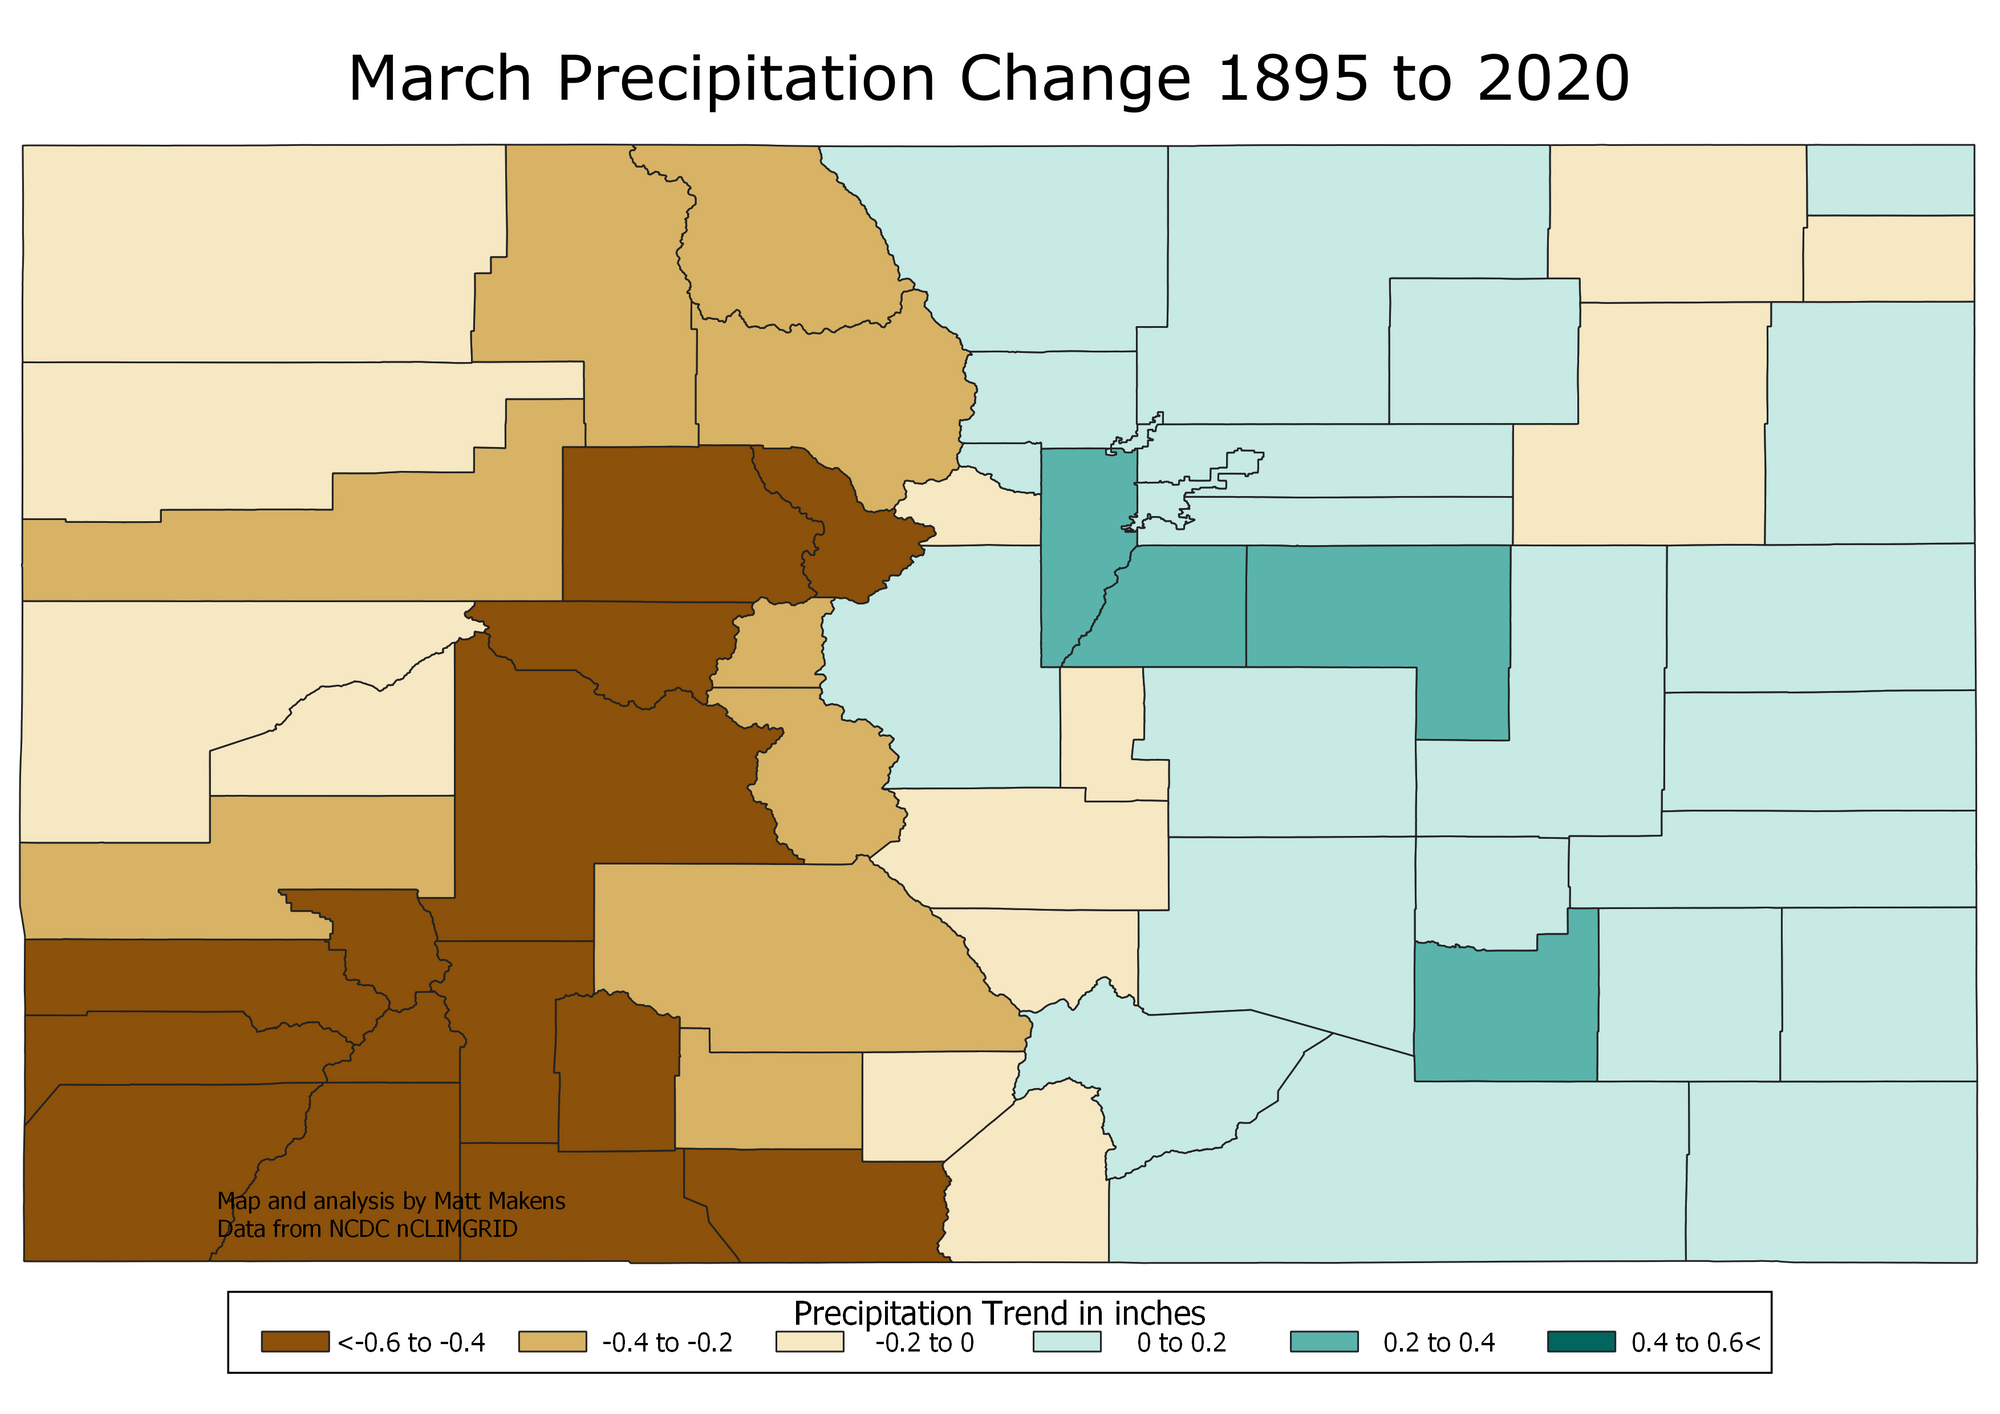
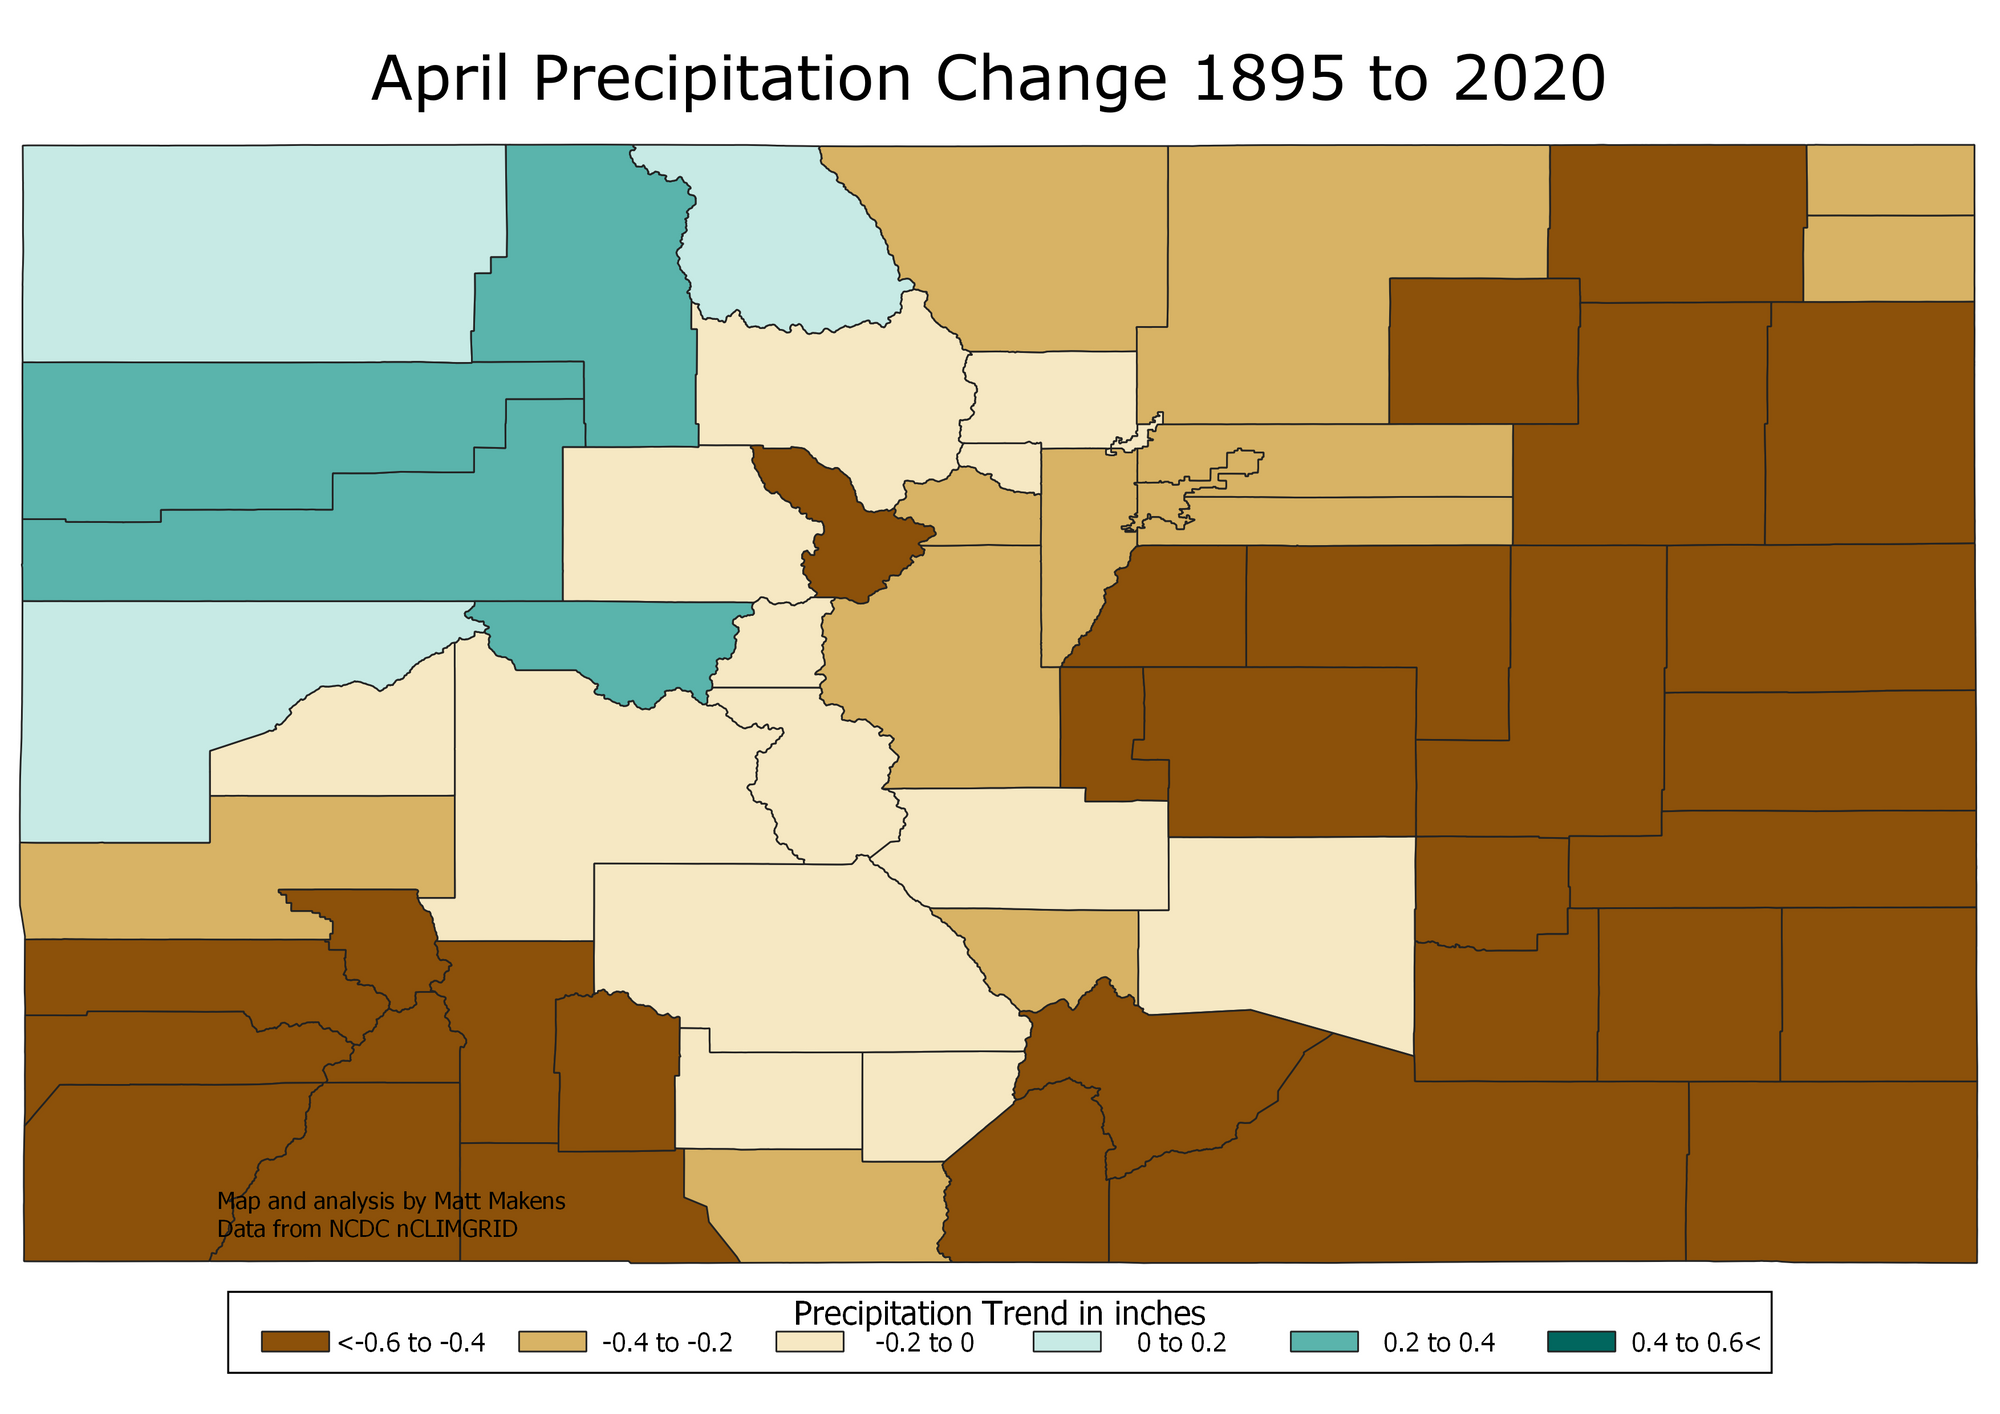
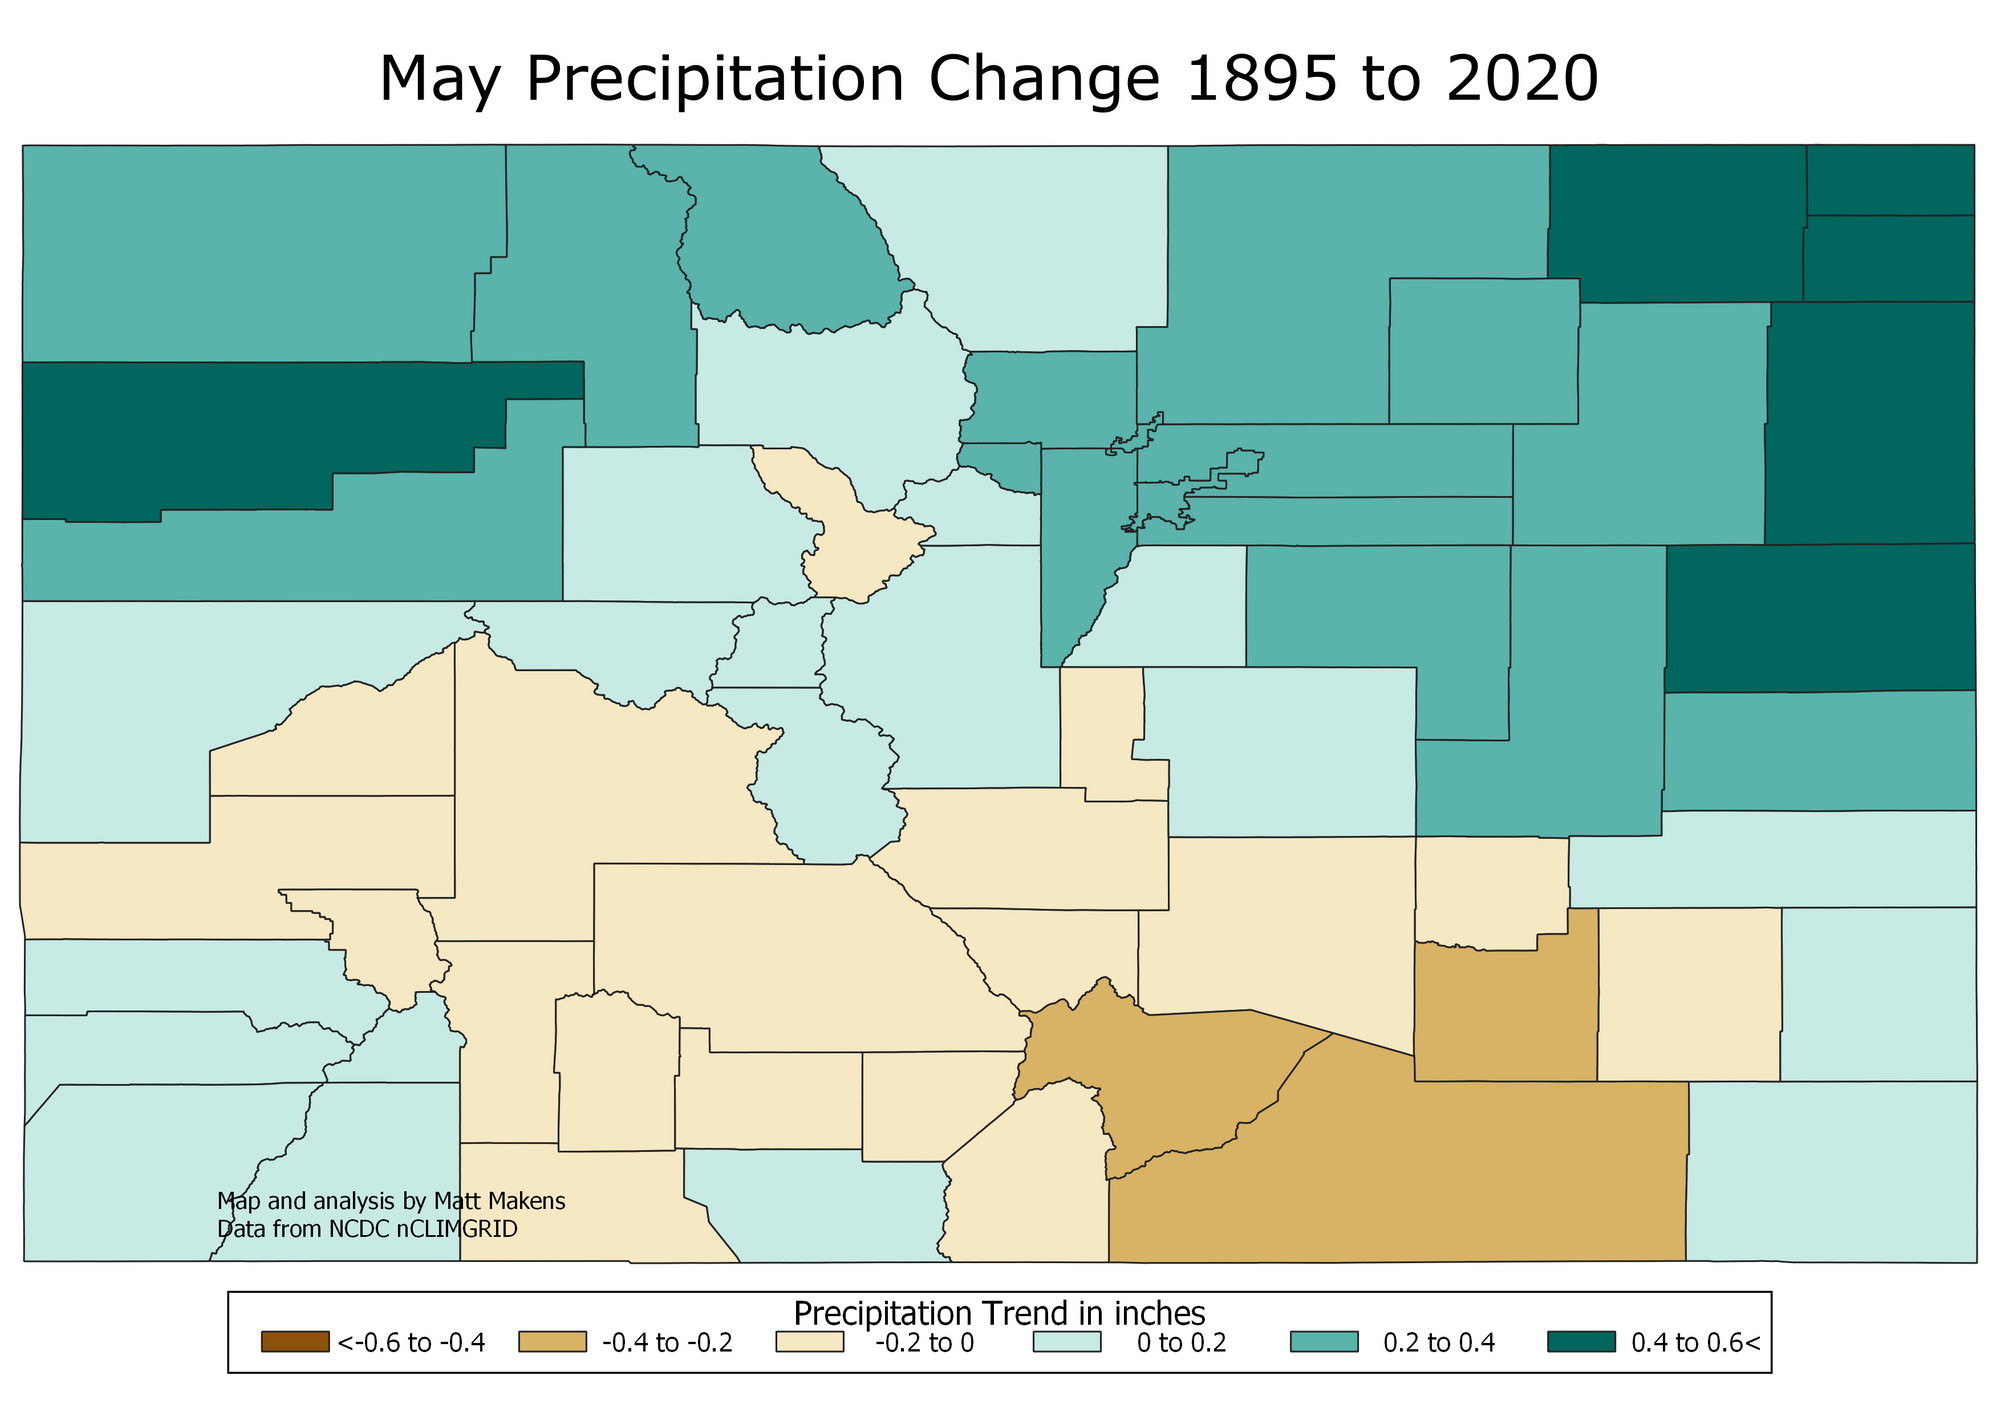
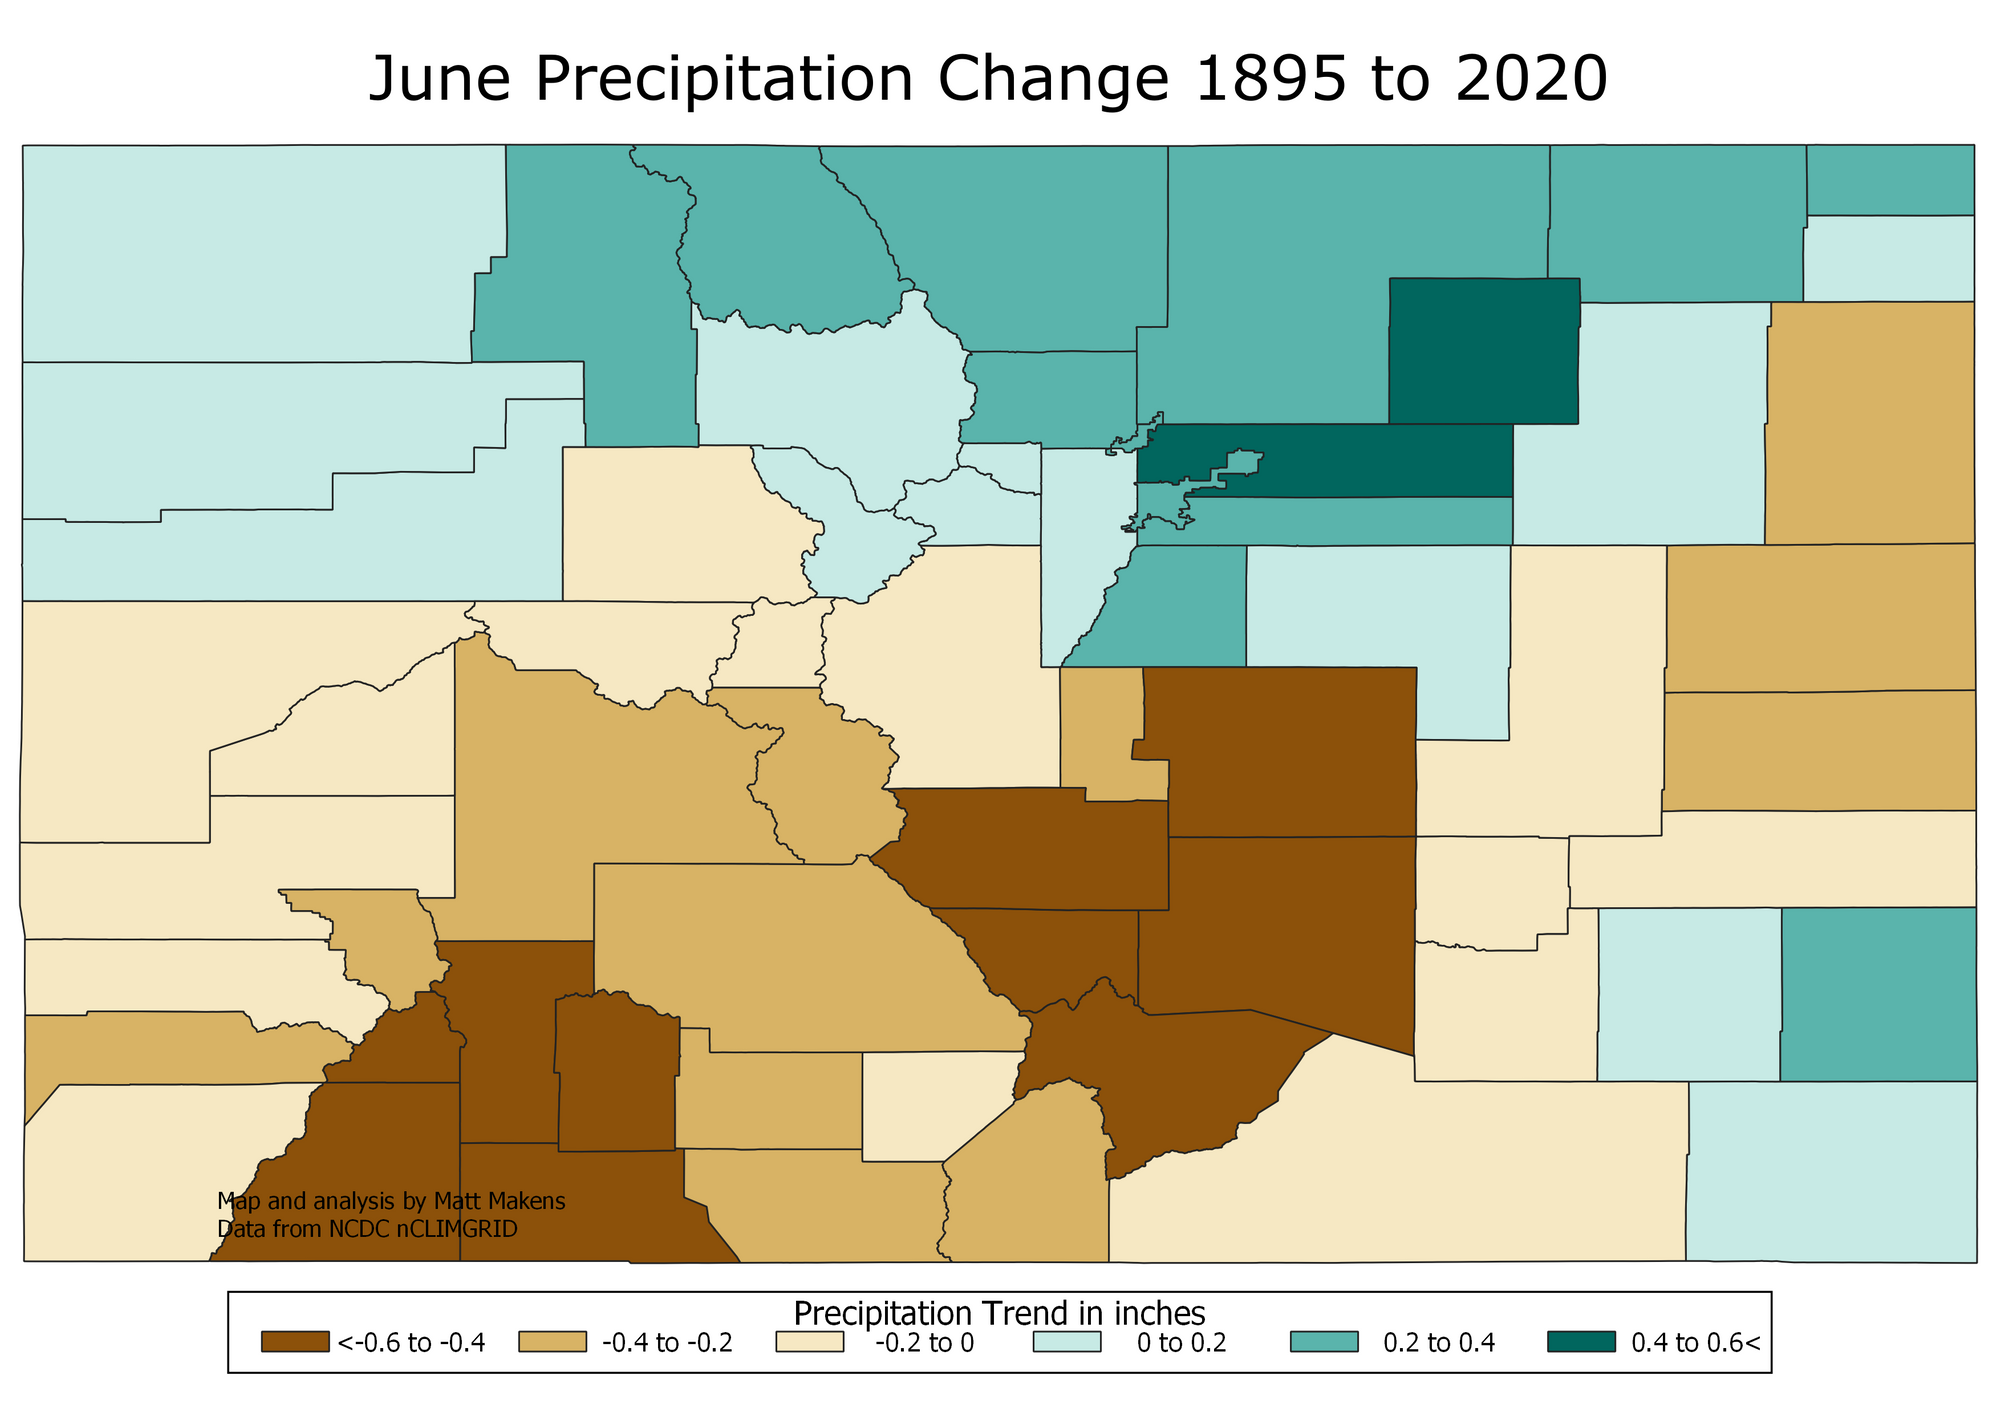
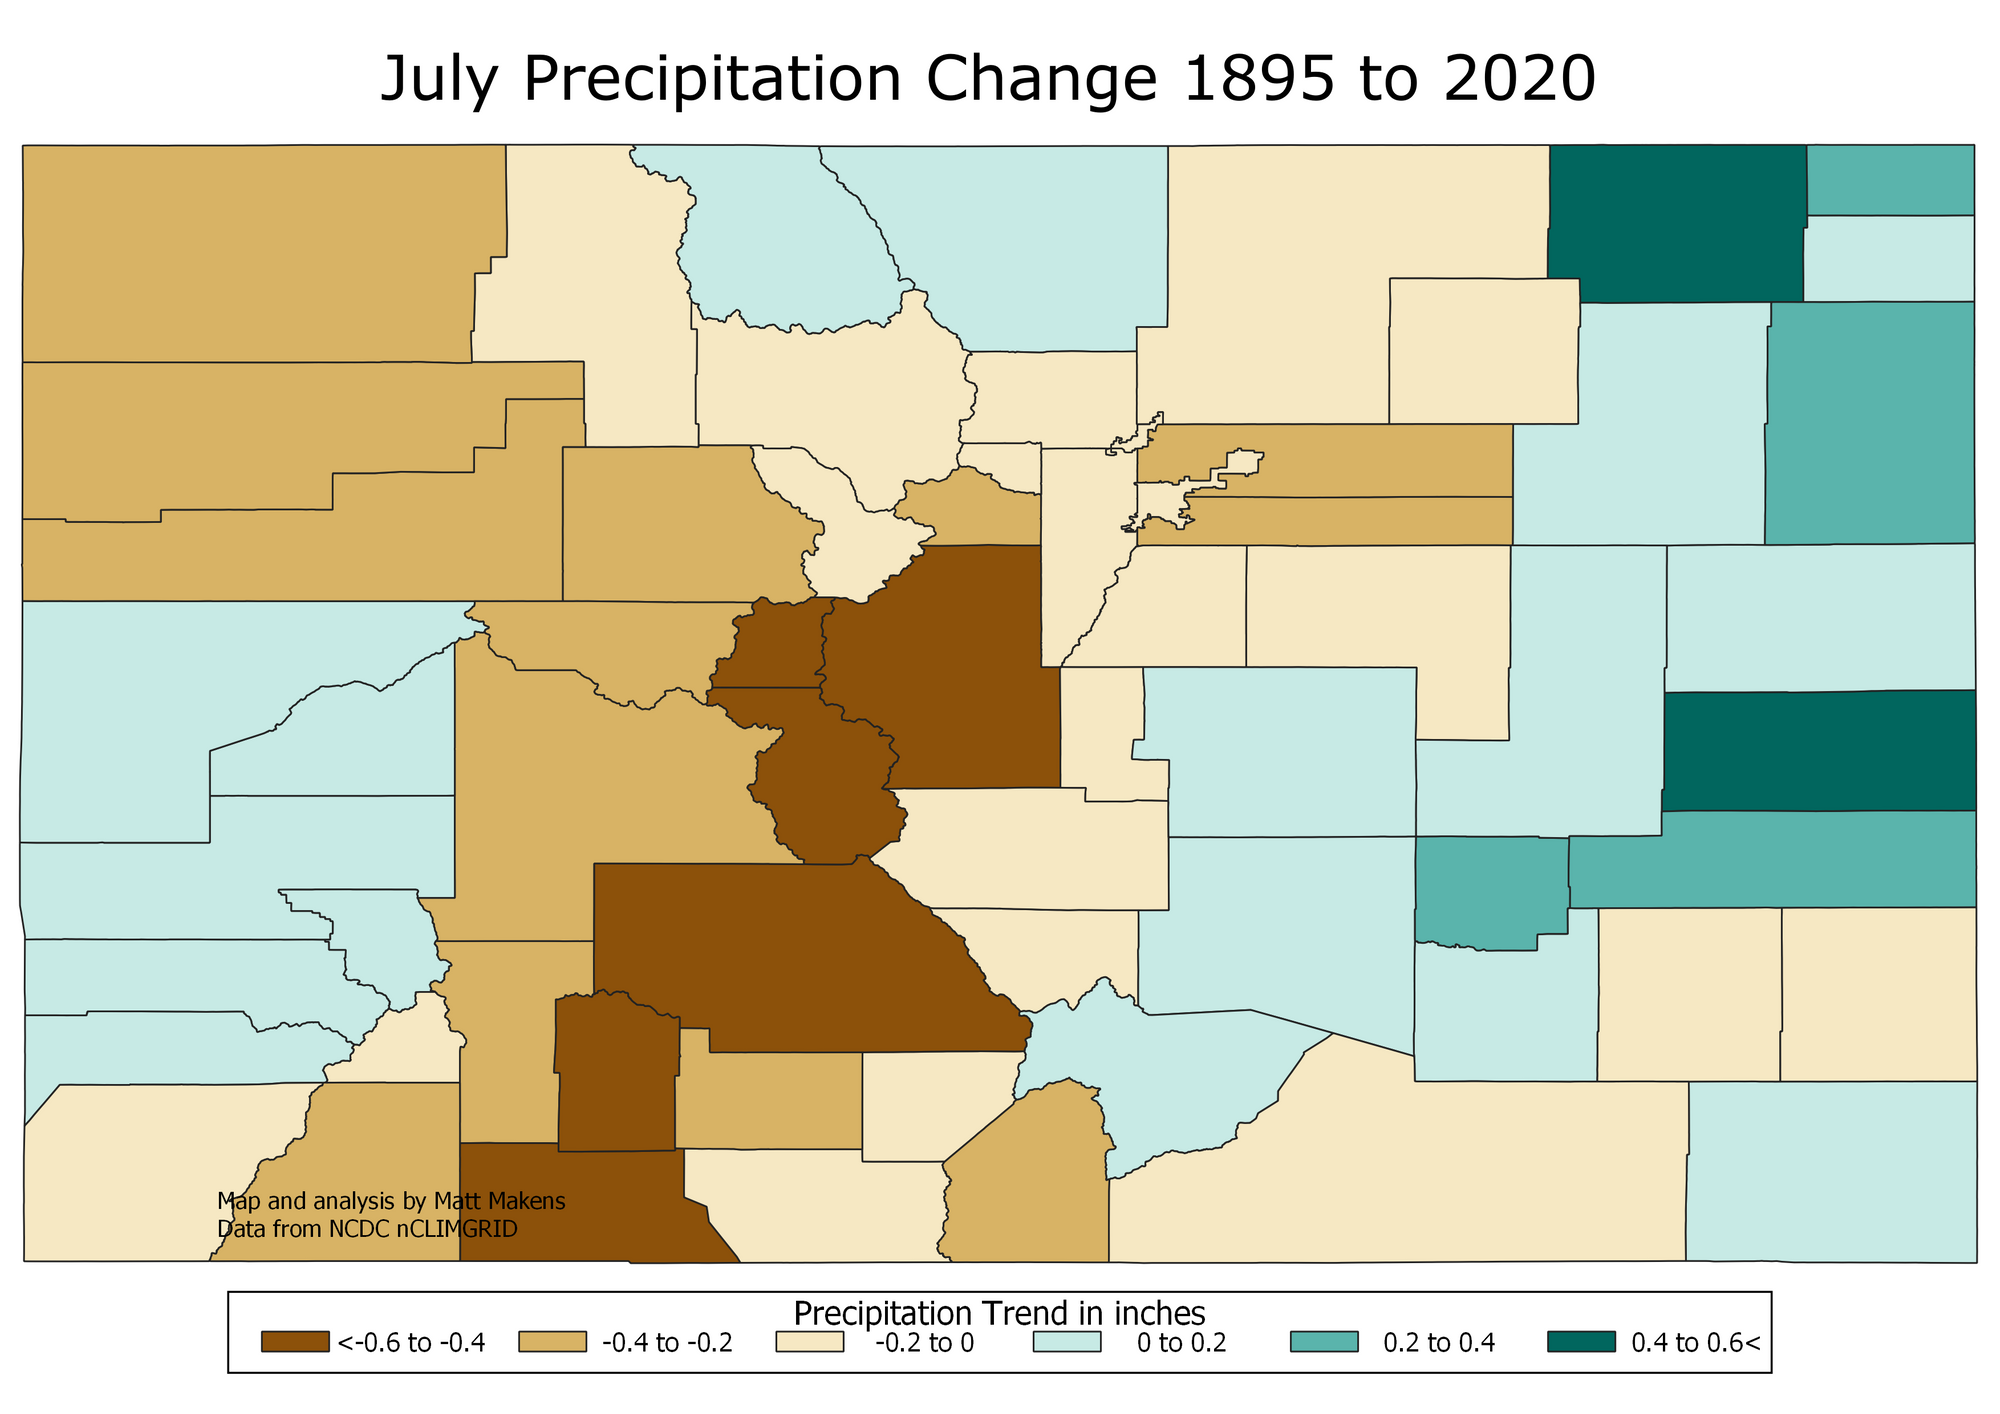
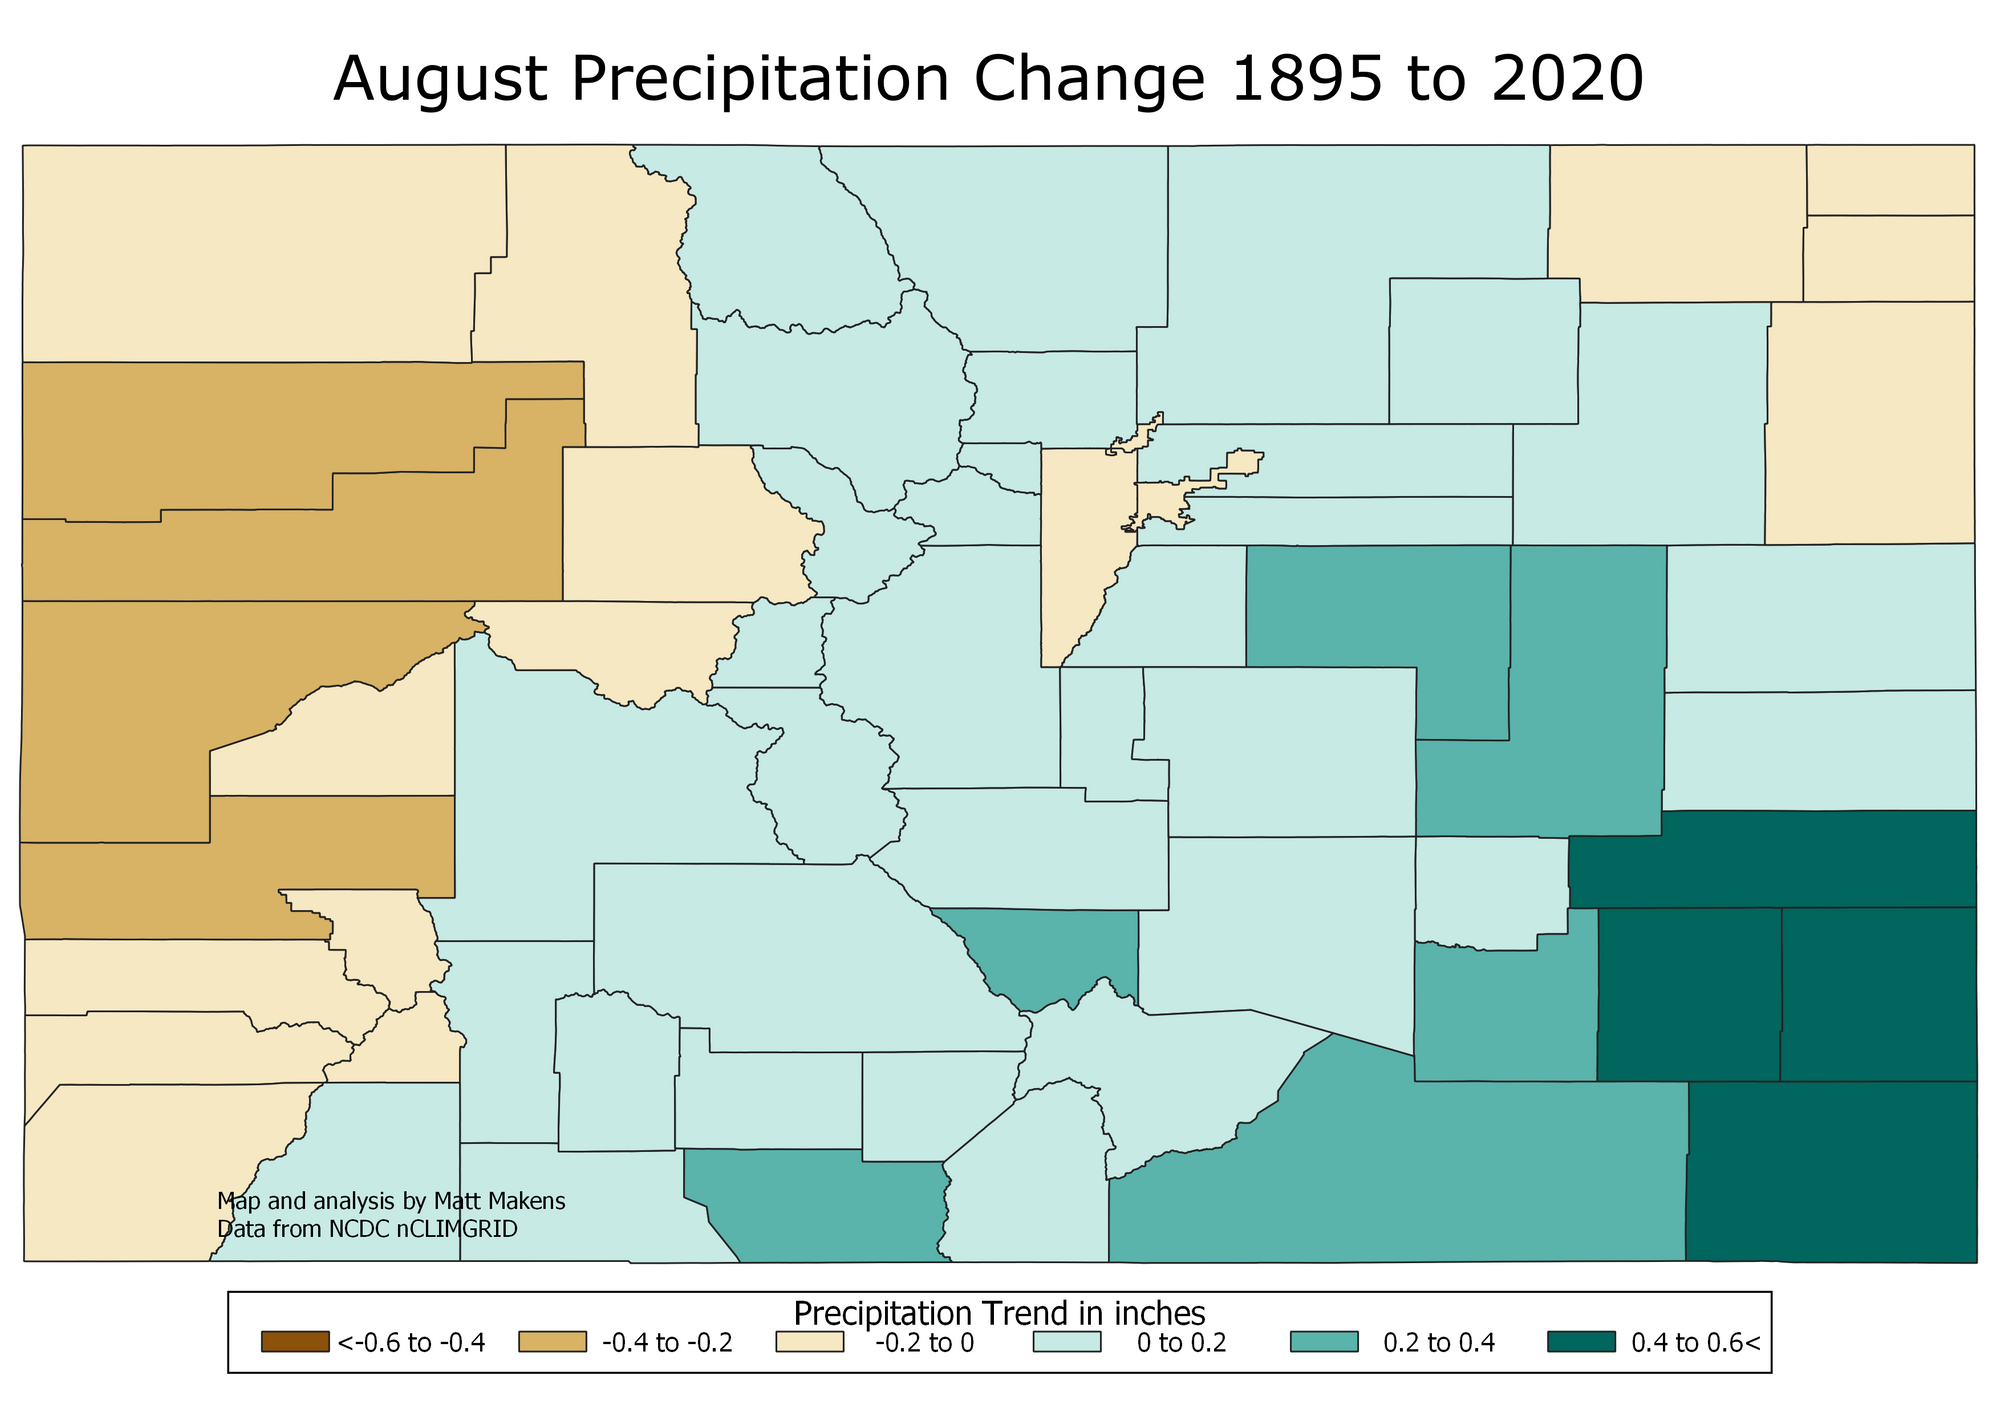
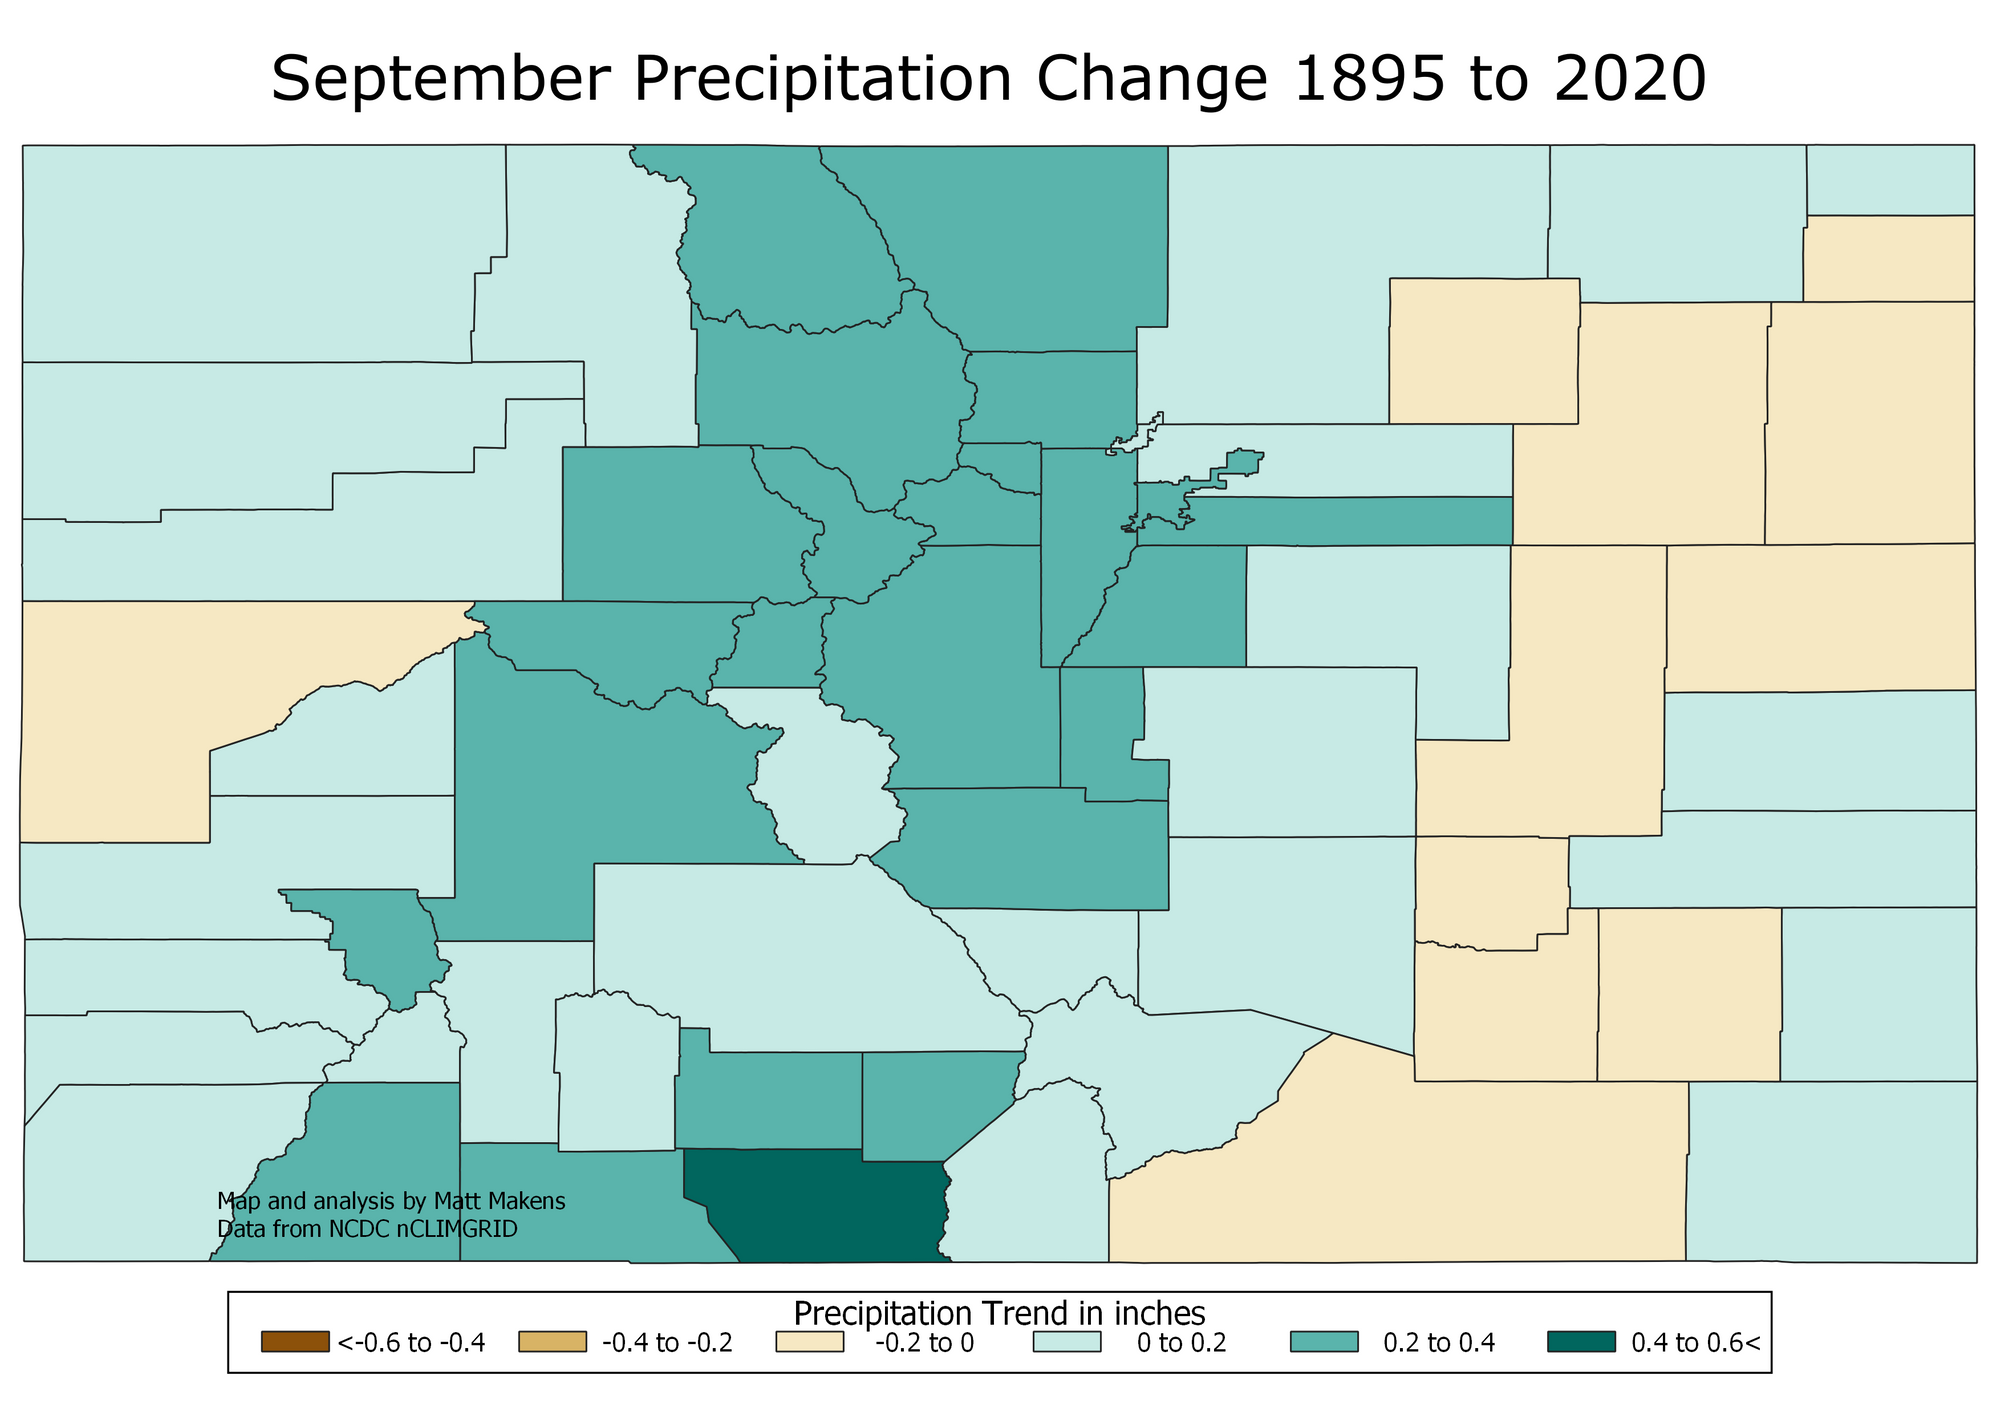
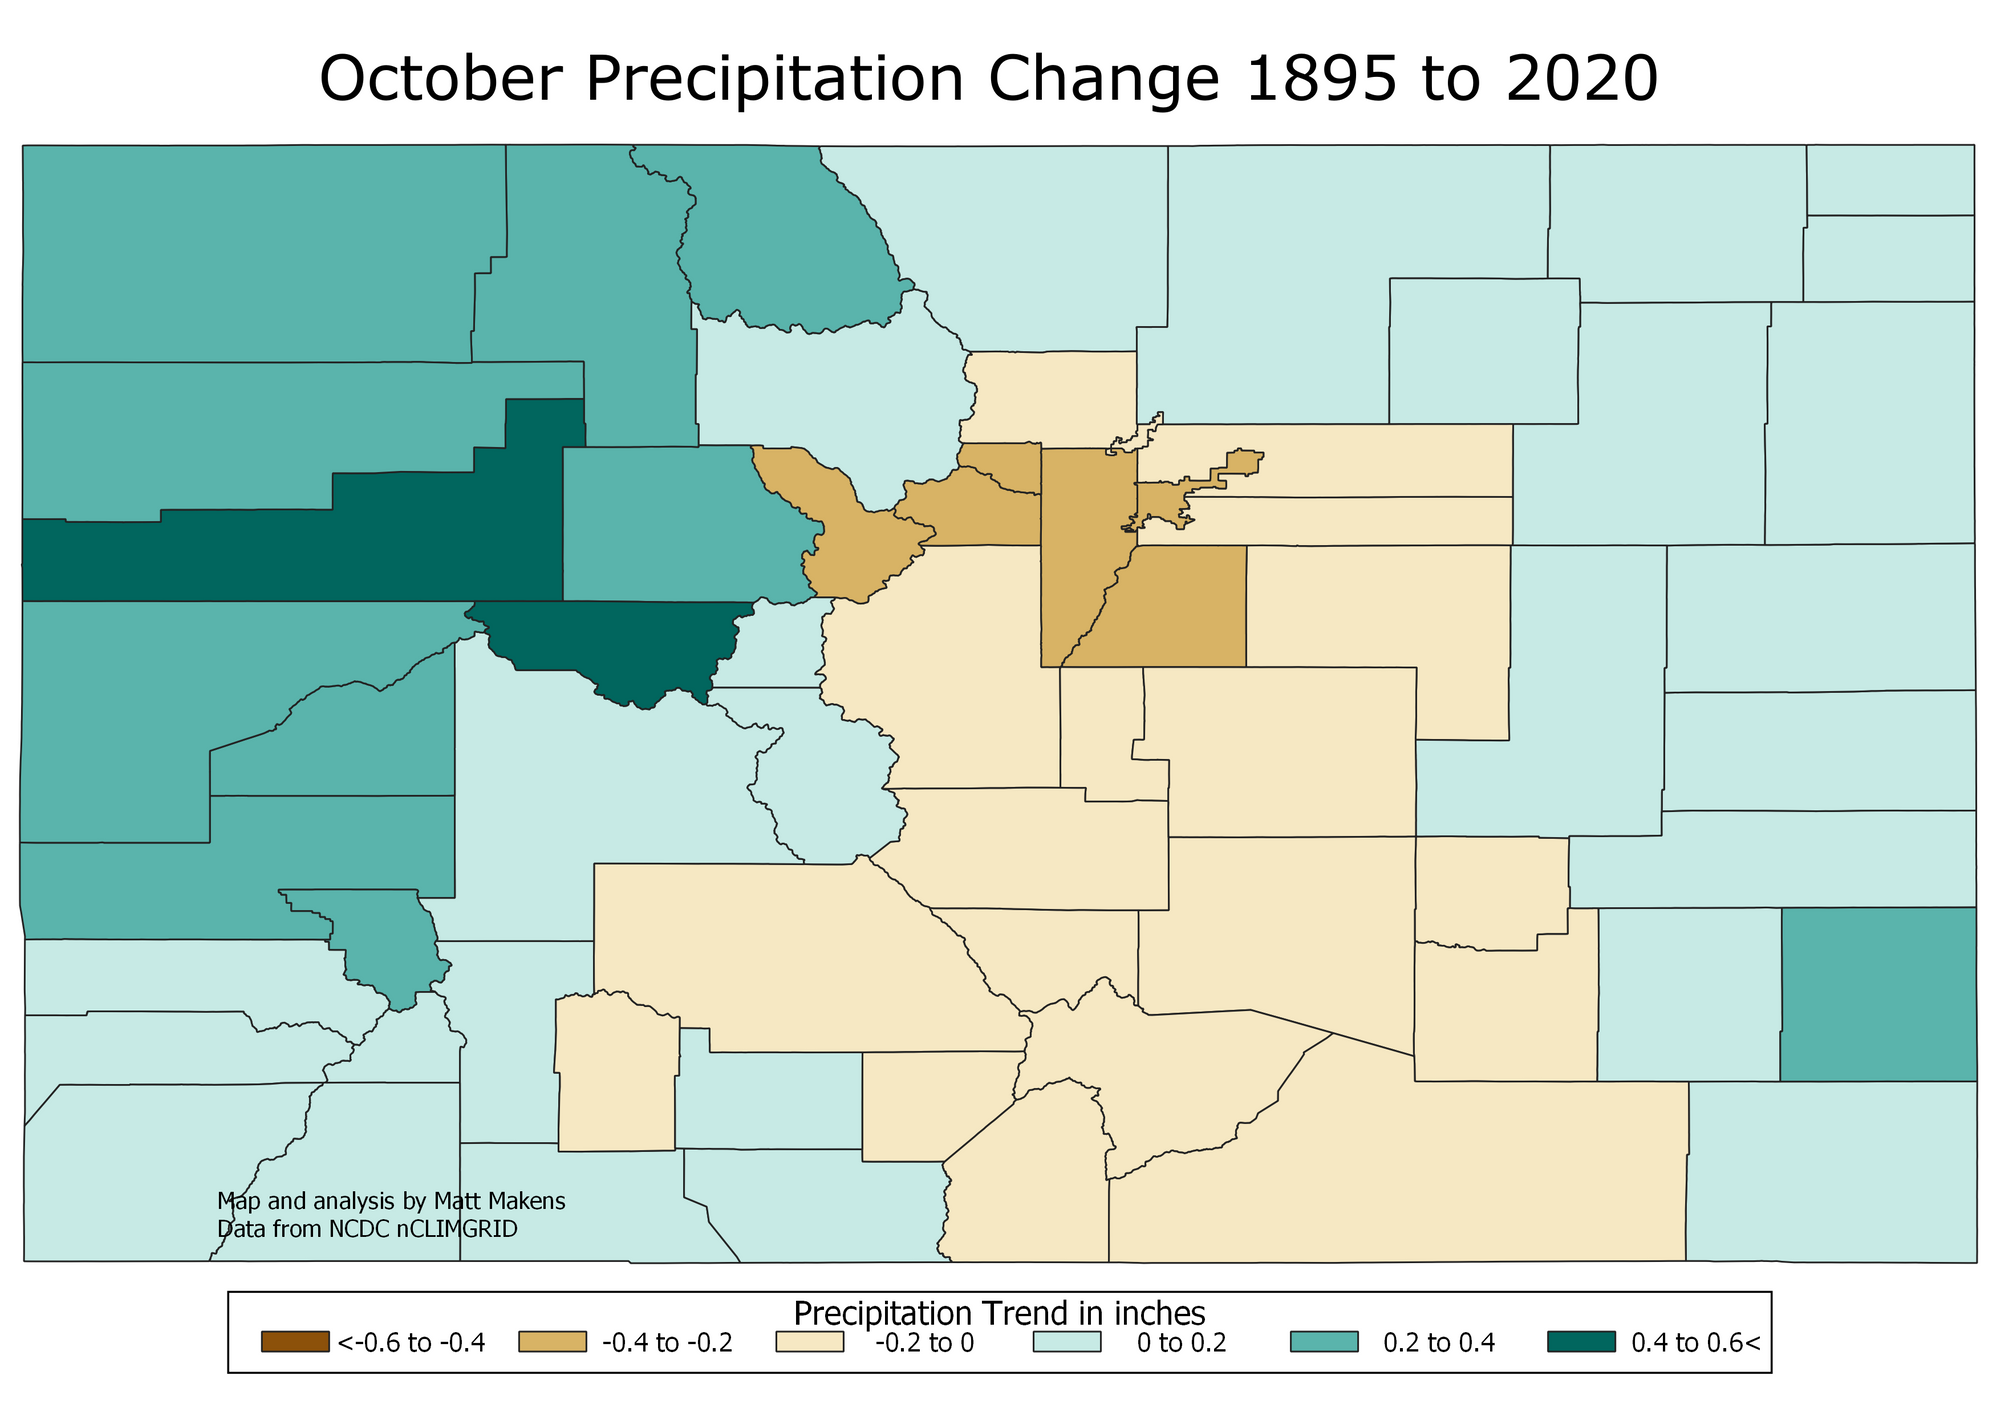
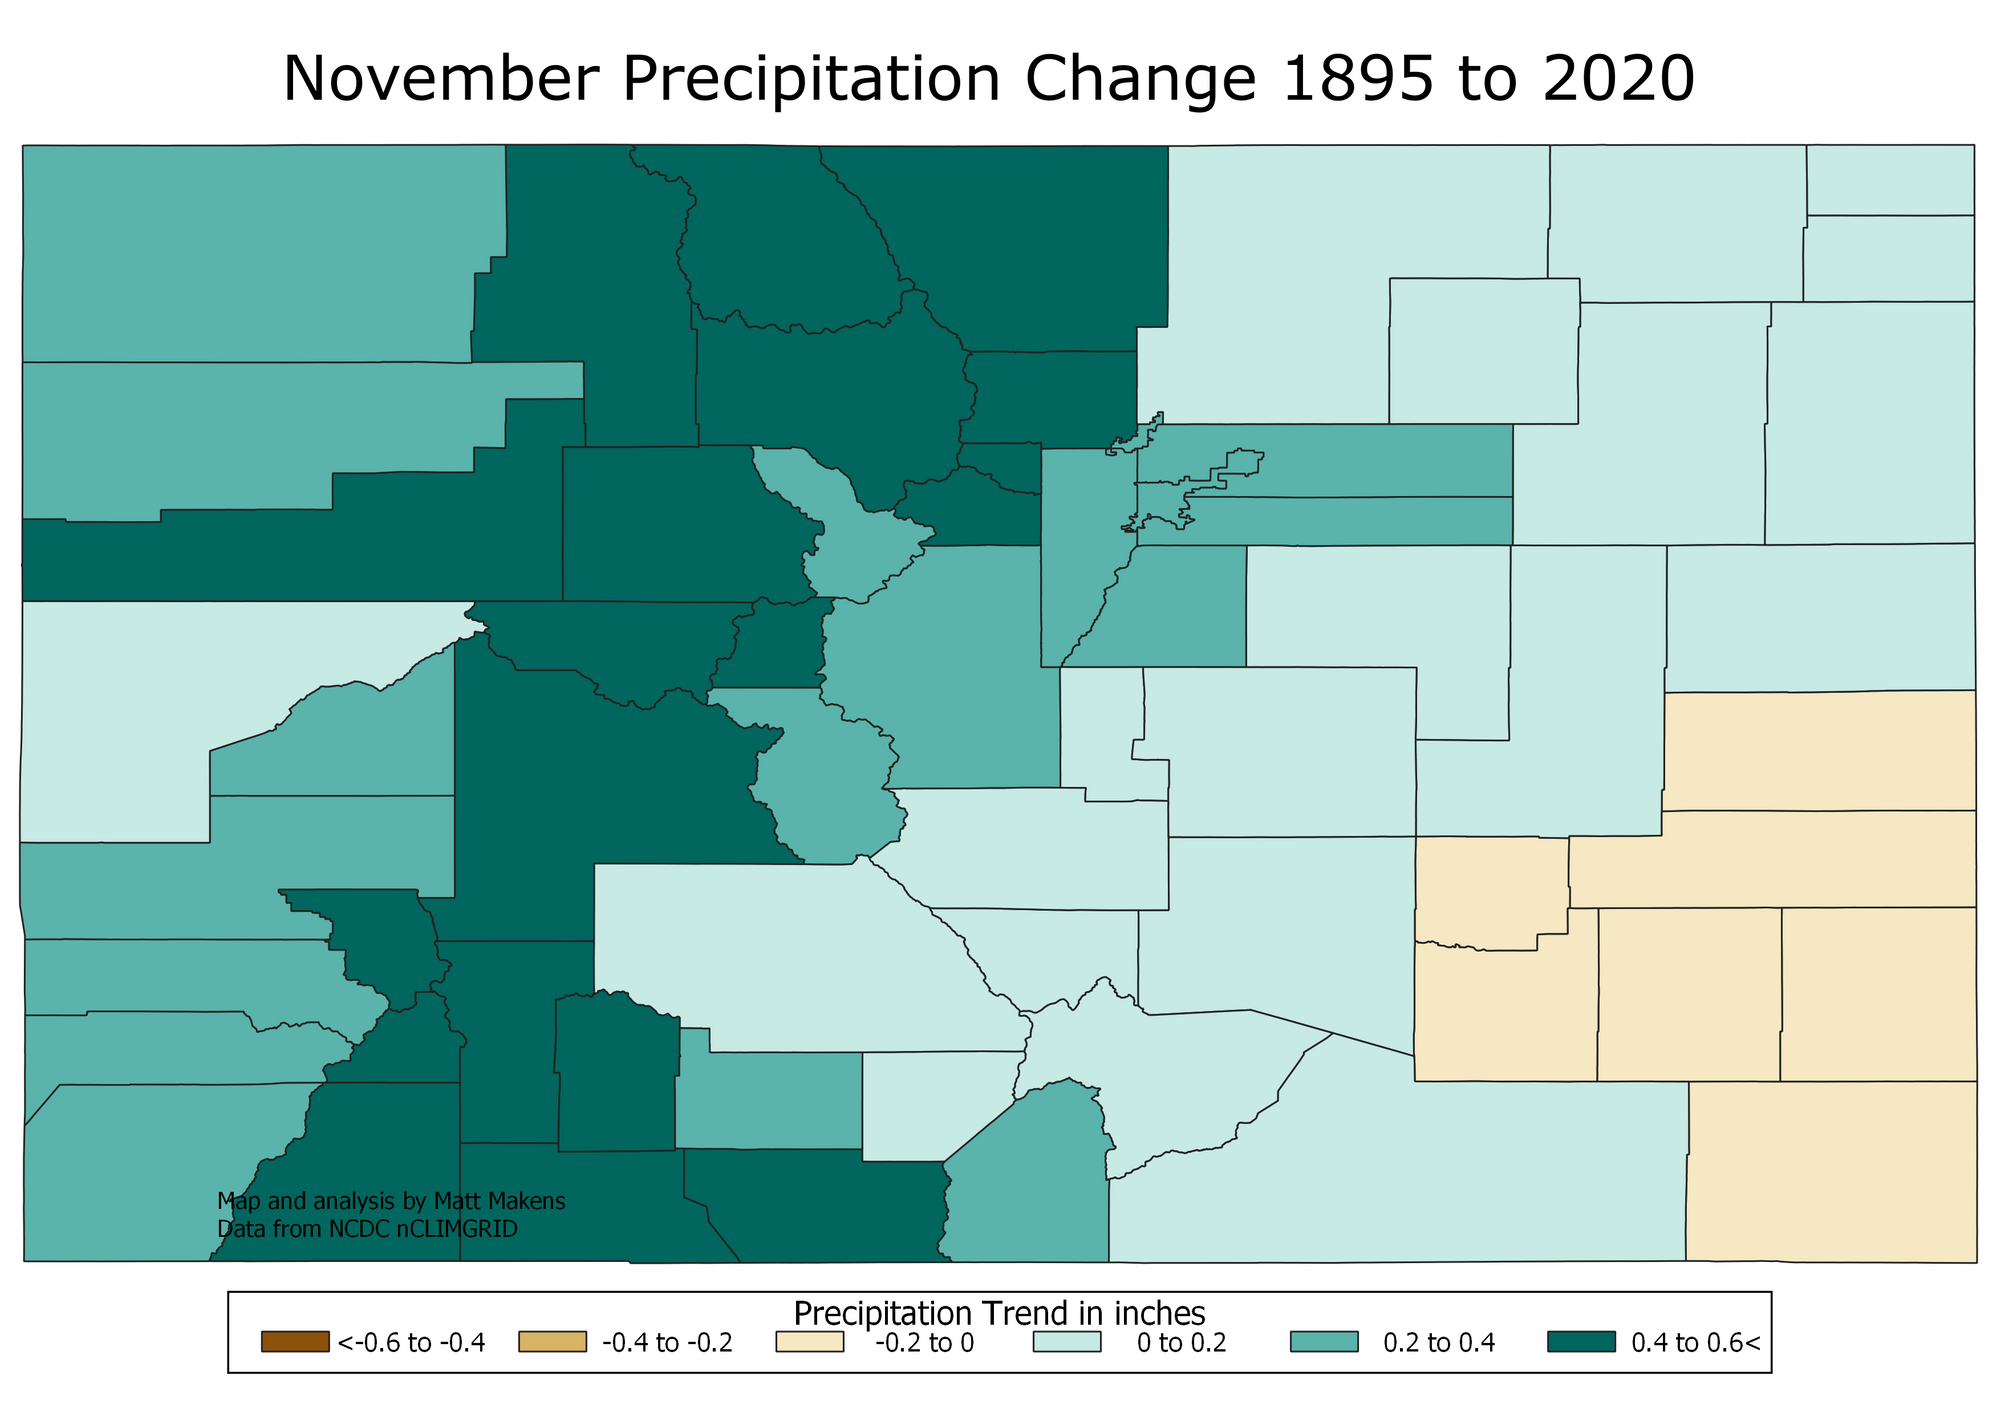
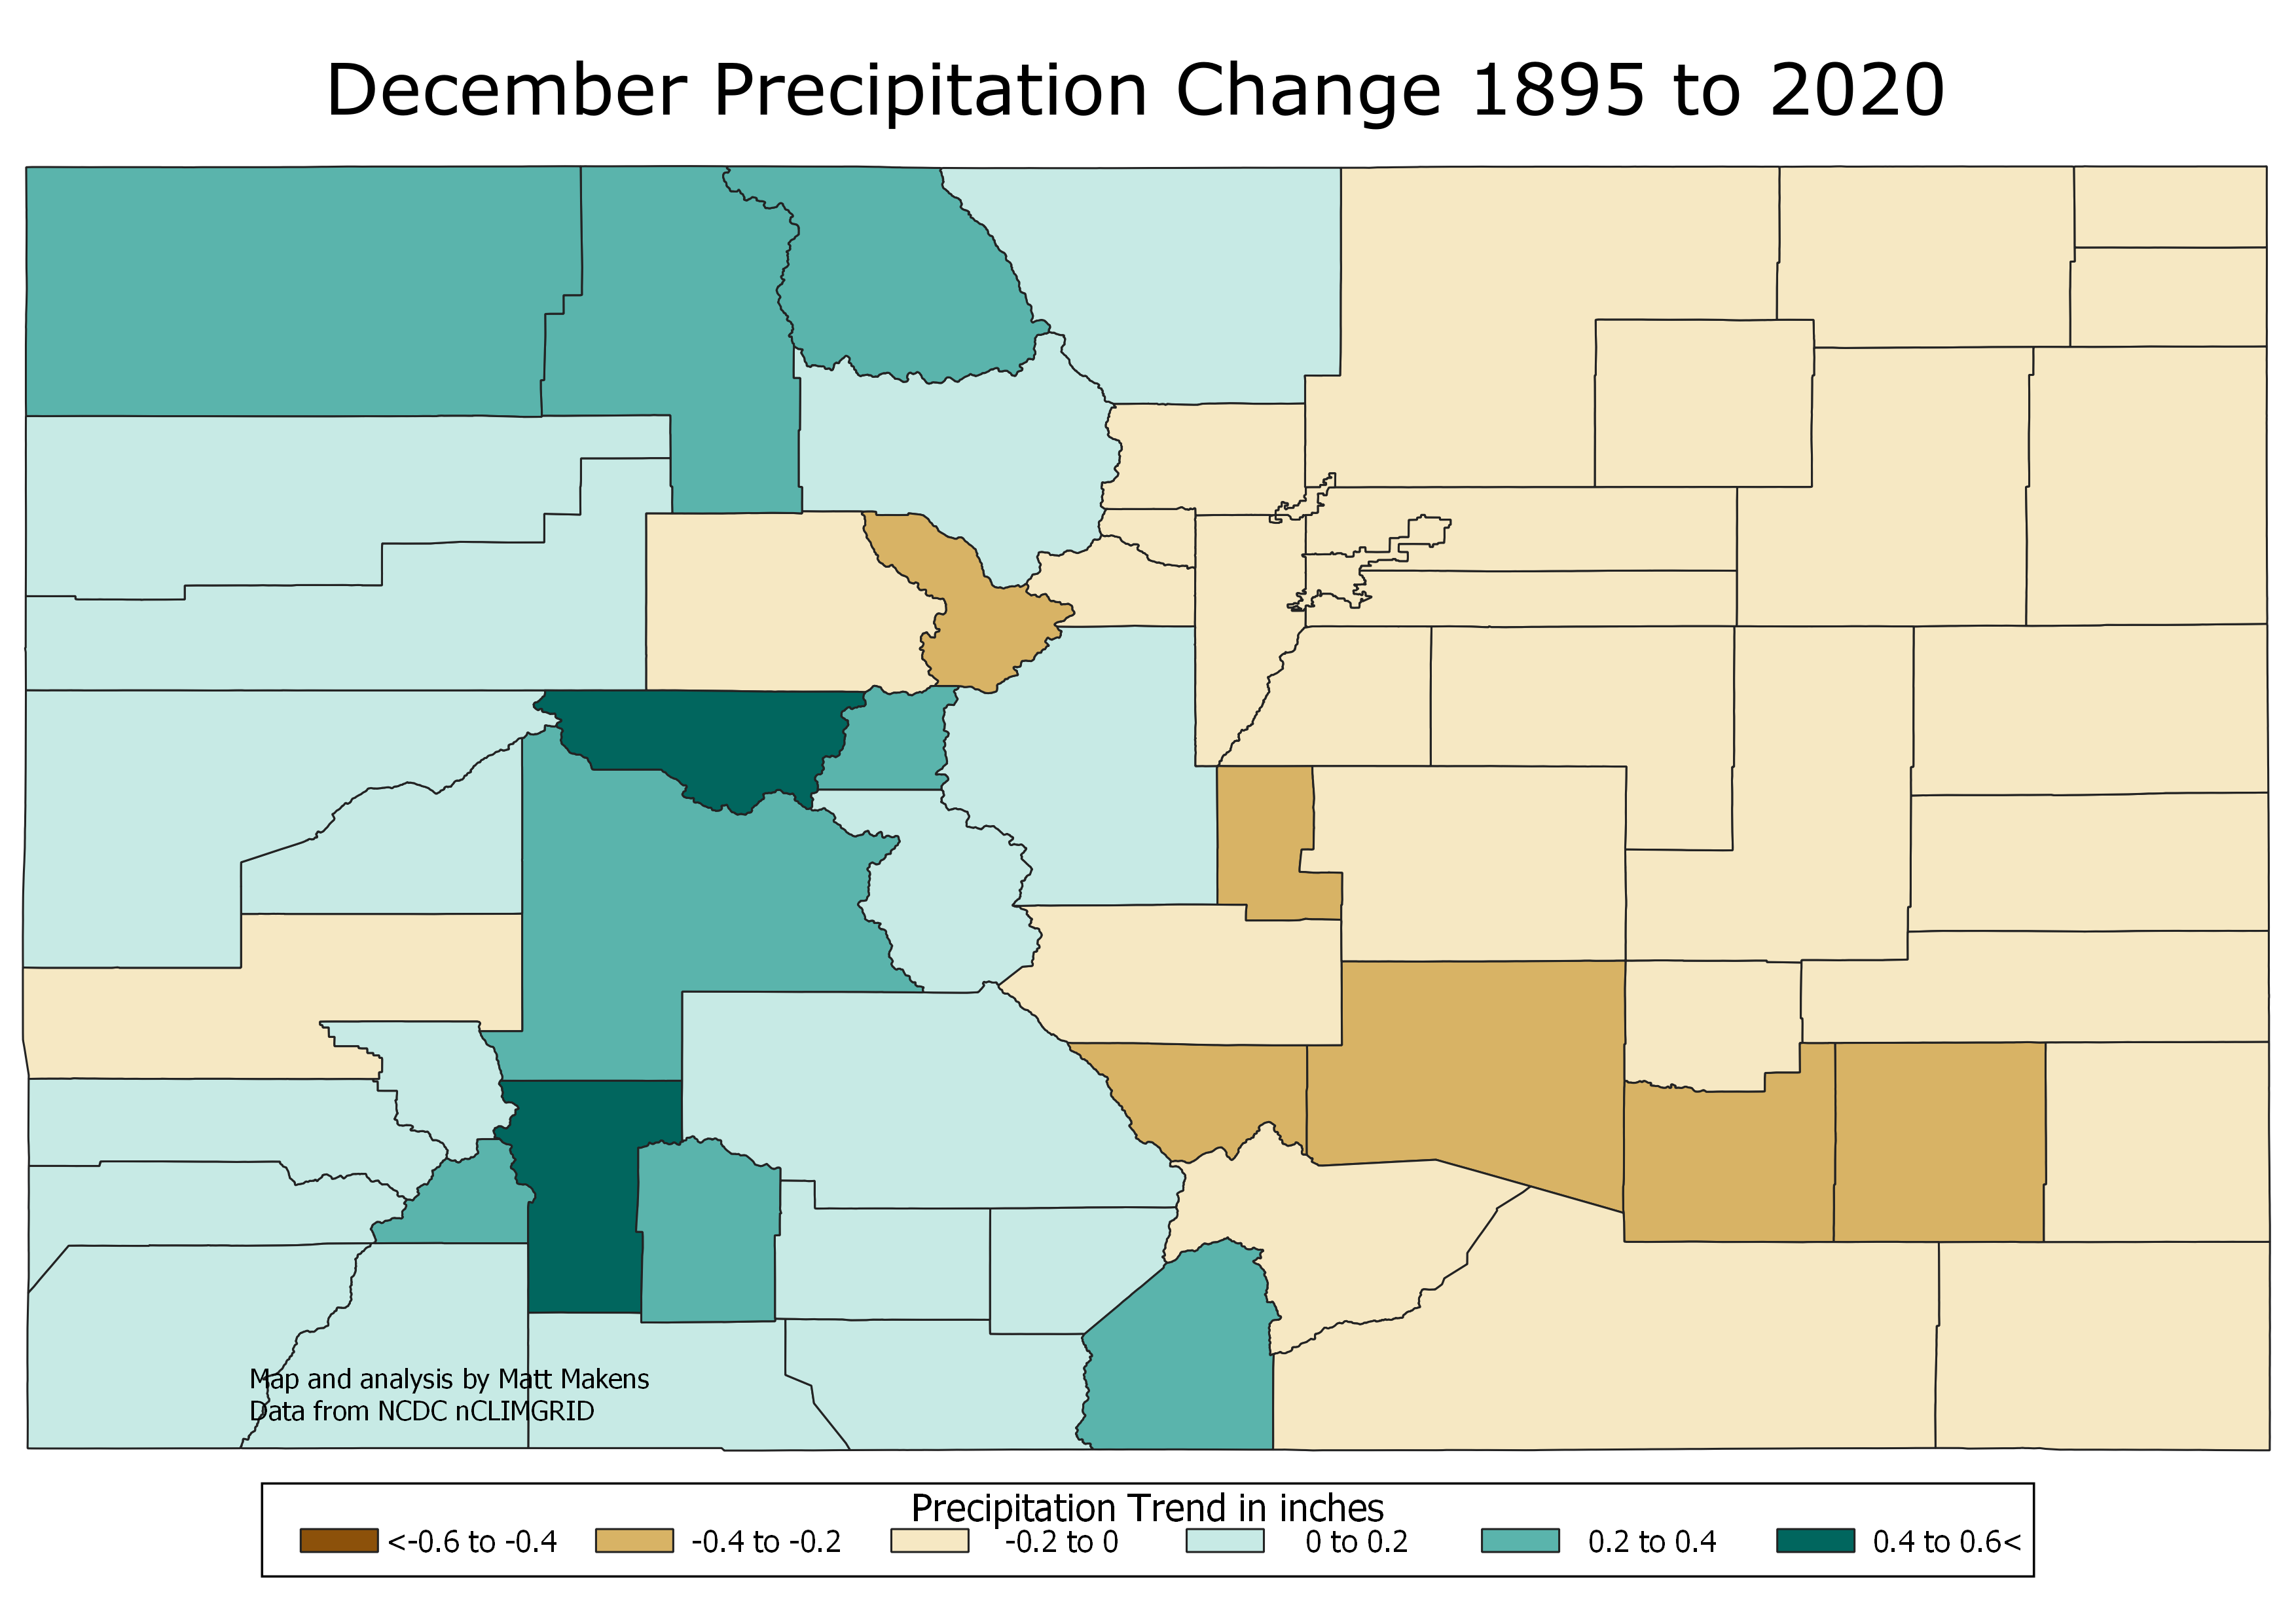
Within the county-level data, we see some interesting trends. We do see a northern shift of precipitation. Metro area counties from the Palmer Divide northward are wetter over time.

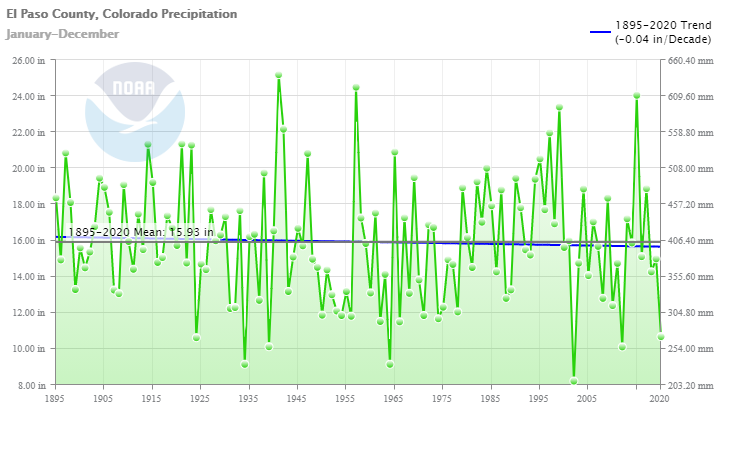
Meanwhile, we can see that El Paso County is one of those within the state that has seen a decrease in precipitation.
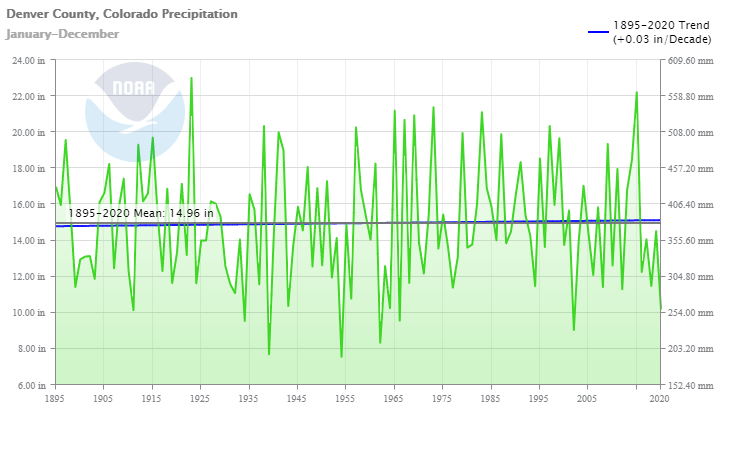
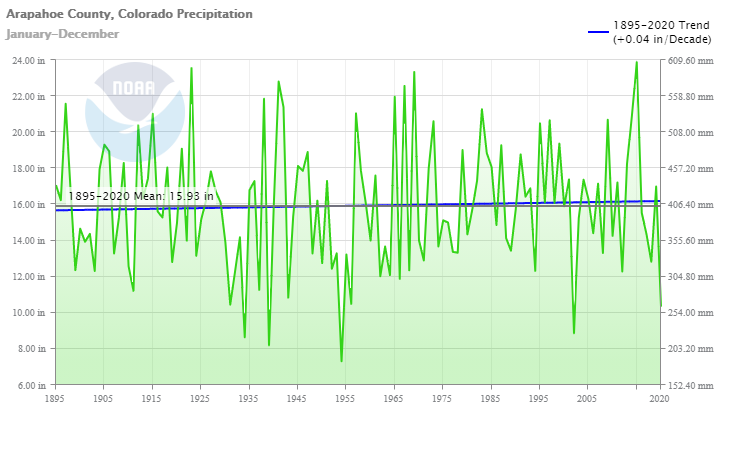
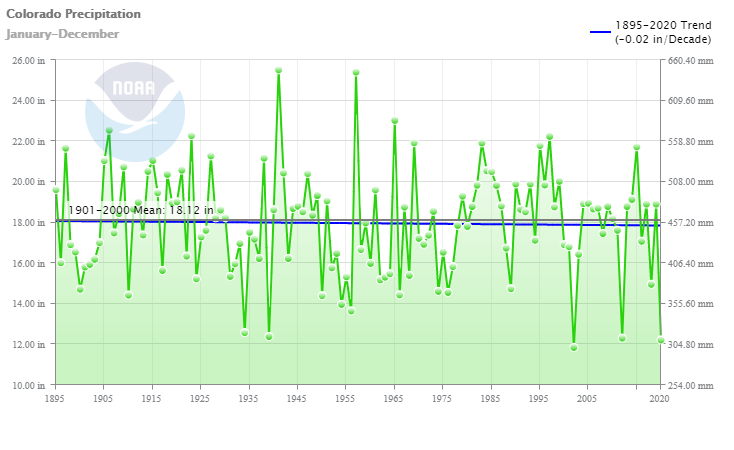
All things considered now, back to the first sentence of this blog when you may have asked, "What is the trend for Colorado as a whole?" The answer: the state has remained with only a slightly drier trend since 1895.
Perhaps the monthly shifts shown above convinced you the trend is more notable. That perception is accurate when considering our recent climate history.
In the past 30 years we have seen a more dramatic decline in annual precipitation across the state; -0.92" per decade since 1990.
That analysis and explanation will wait for a future post, however, you have already been exposed to how the 30-year climatology shifted during this year's updated dataset.