
Colorado forecast: How much snow analog years suggest Denver will see during the upcoming winter season

These kind of outlooks are always popular among social media channels when hype-driven terms and baseless projections scream for epic snowfall. There is a scientific basis that can and should be applied for a general understanding of where seasons are headed in terms of temperatures and precipitation.
I explain more about the thinking and method in the video below, but the bottom line is that in longer ranges an almanac/climatology becomes one of the stronger forecast methods.
Take a 14-day forecast for example. Modeling will project with accuracy for say through day 7 or maybe 10. Go beyond that time and climatology begins to show forecast accuracy over the models.
With that in mind, we can take history as a guide and develop a seasonal forecast with some degree of accuracy. In the case of this winter, 2022-'23, we know we are starting out in La Niña and will trend toward a weaker La Niña and potentially a neutral pattern to close out the upcoming cold season. That does assume we don't end up getting suddenly surprised by a rapid onset of El Niño.
We also know that the state of the Pacific and Atlantic Oceans overall are not likely to rapidly change on us. So, we can take our long-term climatology and pull out years most similar to what is expected through early/mid 2023. In this case, I think La Niña years play most heavily on the first half of the snow season, and then a sampling of La Niña and Neutral years for the remainder.
If we look at the long-term climatology for snowfall around Colorado, we have this as a starting point...the period of record. For this, I'm using NOHRSC data which I have access to starting in 2008.
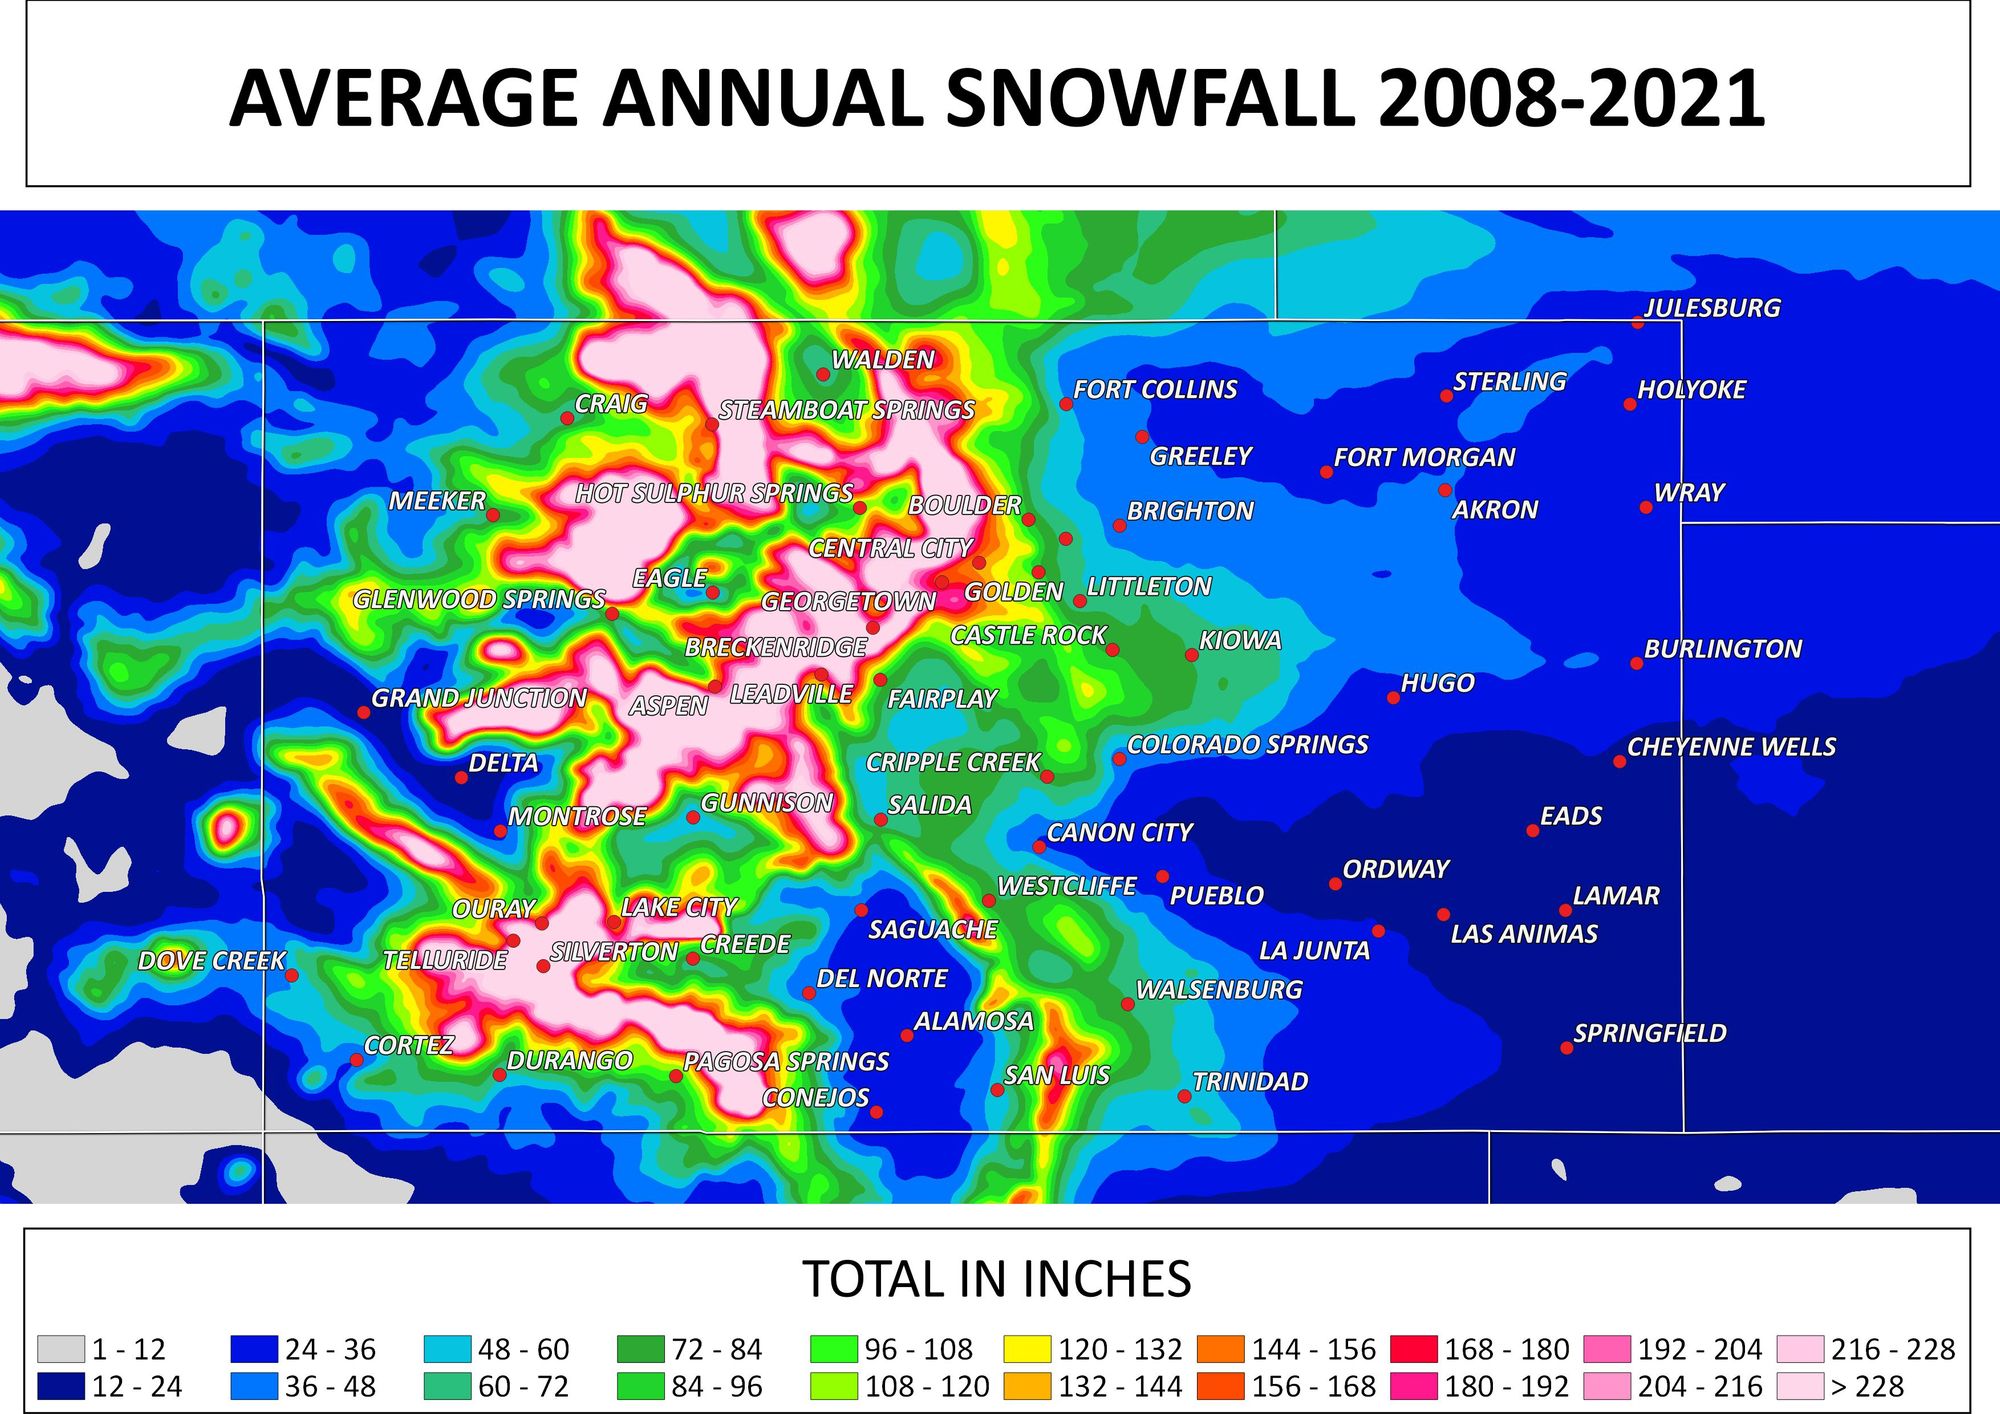
We know there are years in that period of record that make no sense to use this year, like strong El Niño years, so we can drop those.
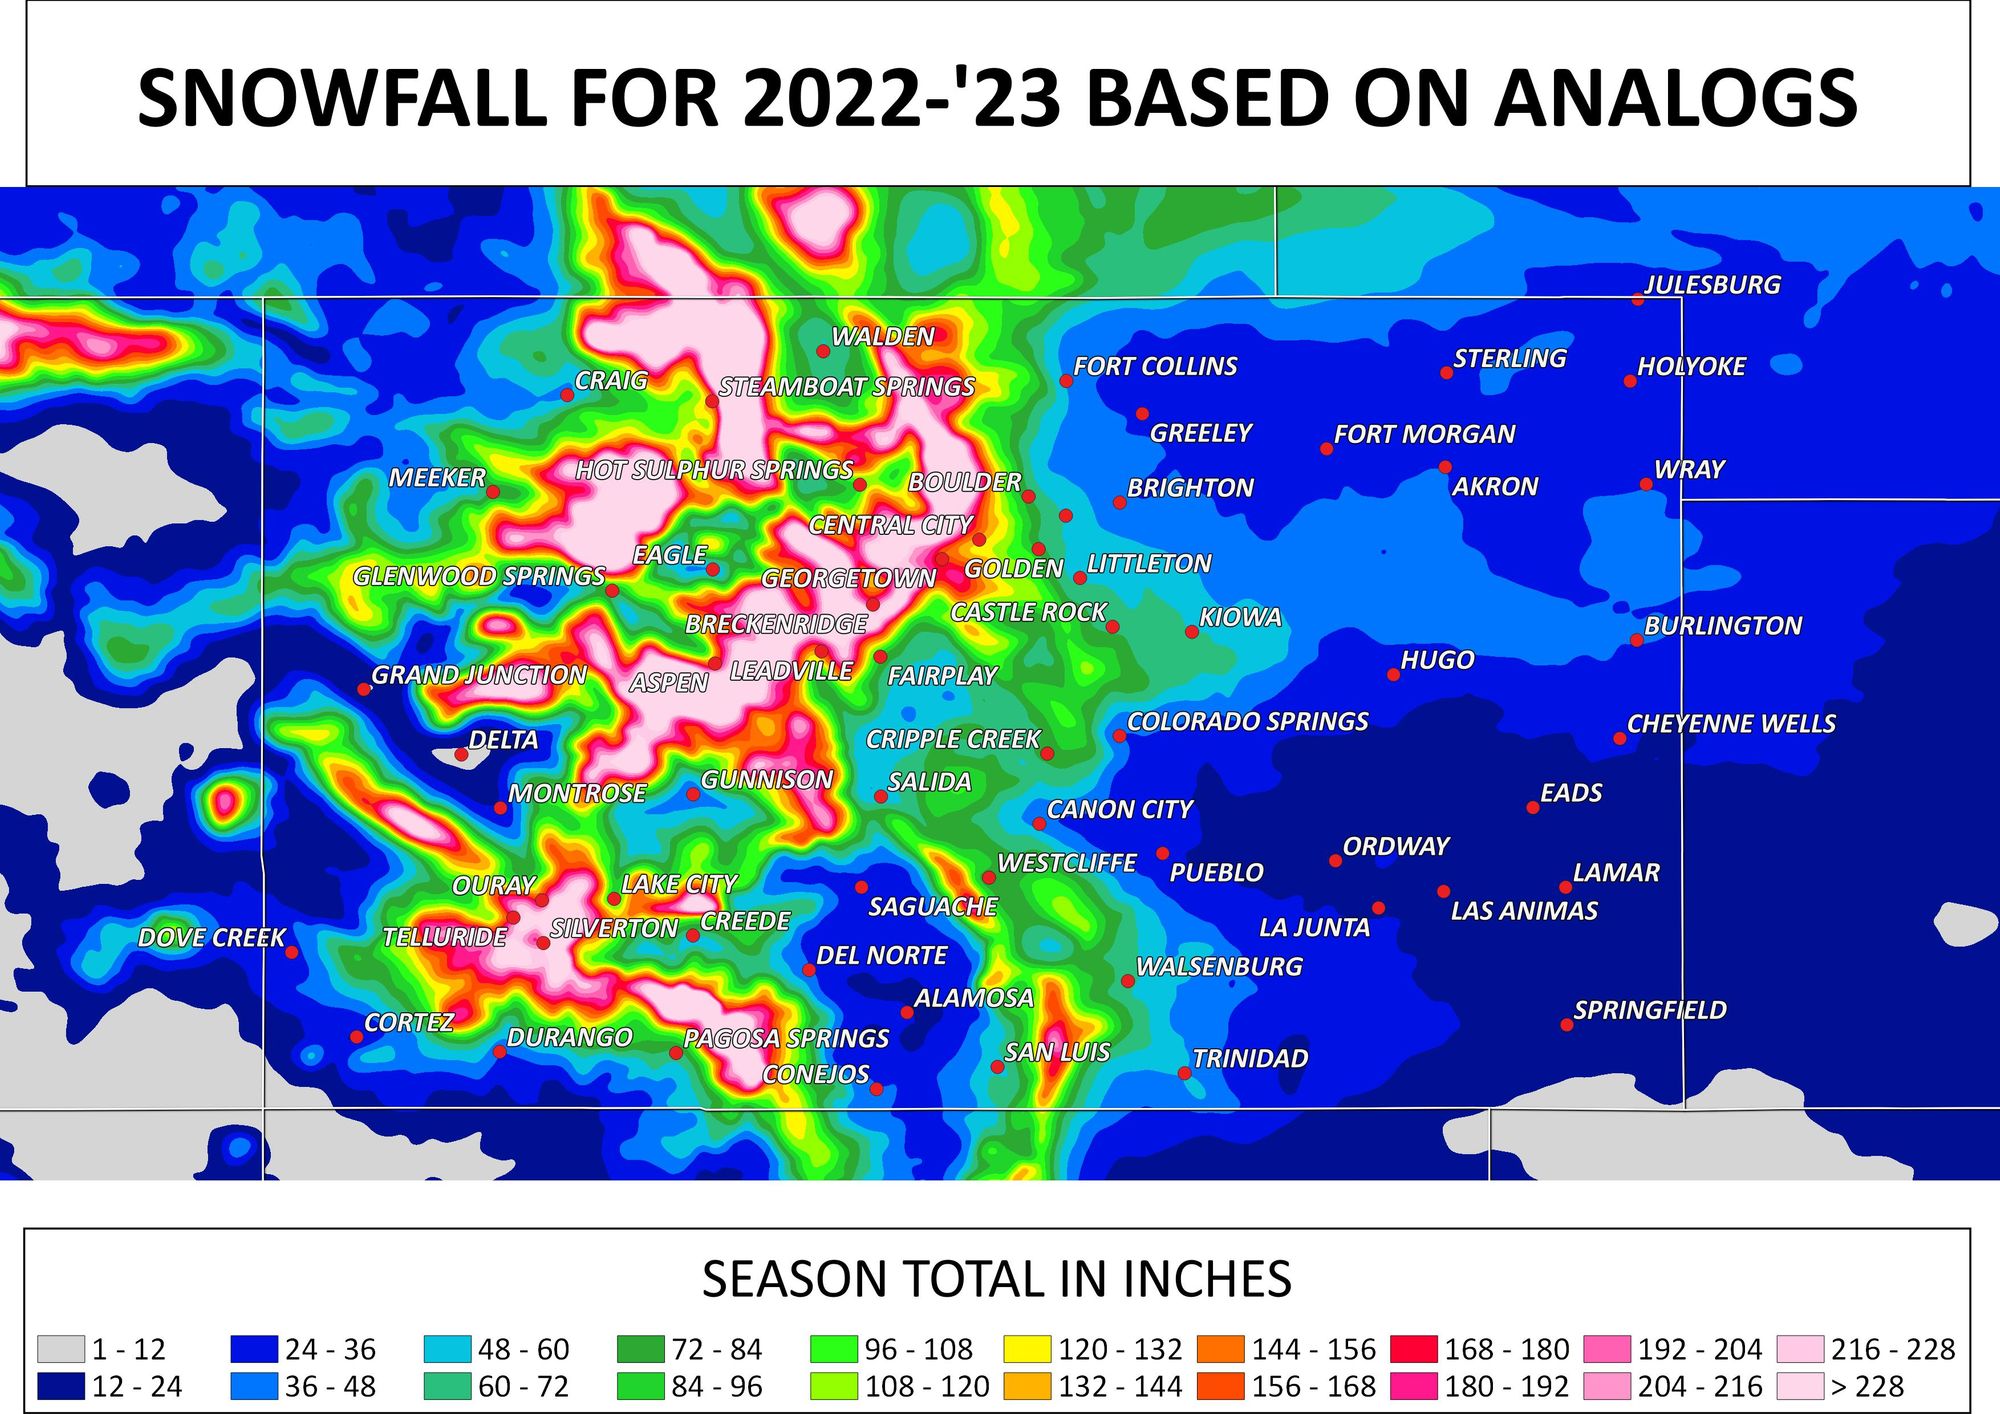
The best-fit approach leads us to the snowfall expected as it relates to most similar years in our past.
Compare that to our climatology, we can see whether the "winter" (winter is really December, January and February, but I'm using the term winter here to apply to our entire snow season which is September to May) will be snowier or drier than the average.
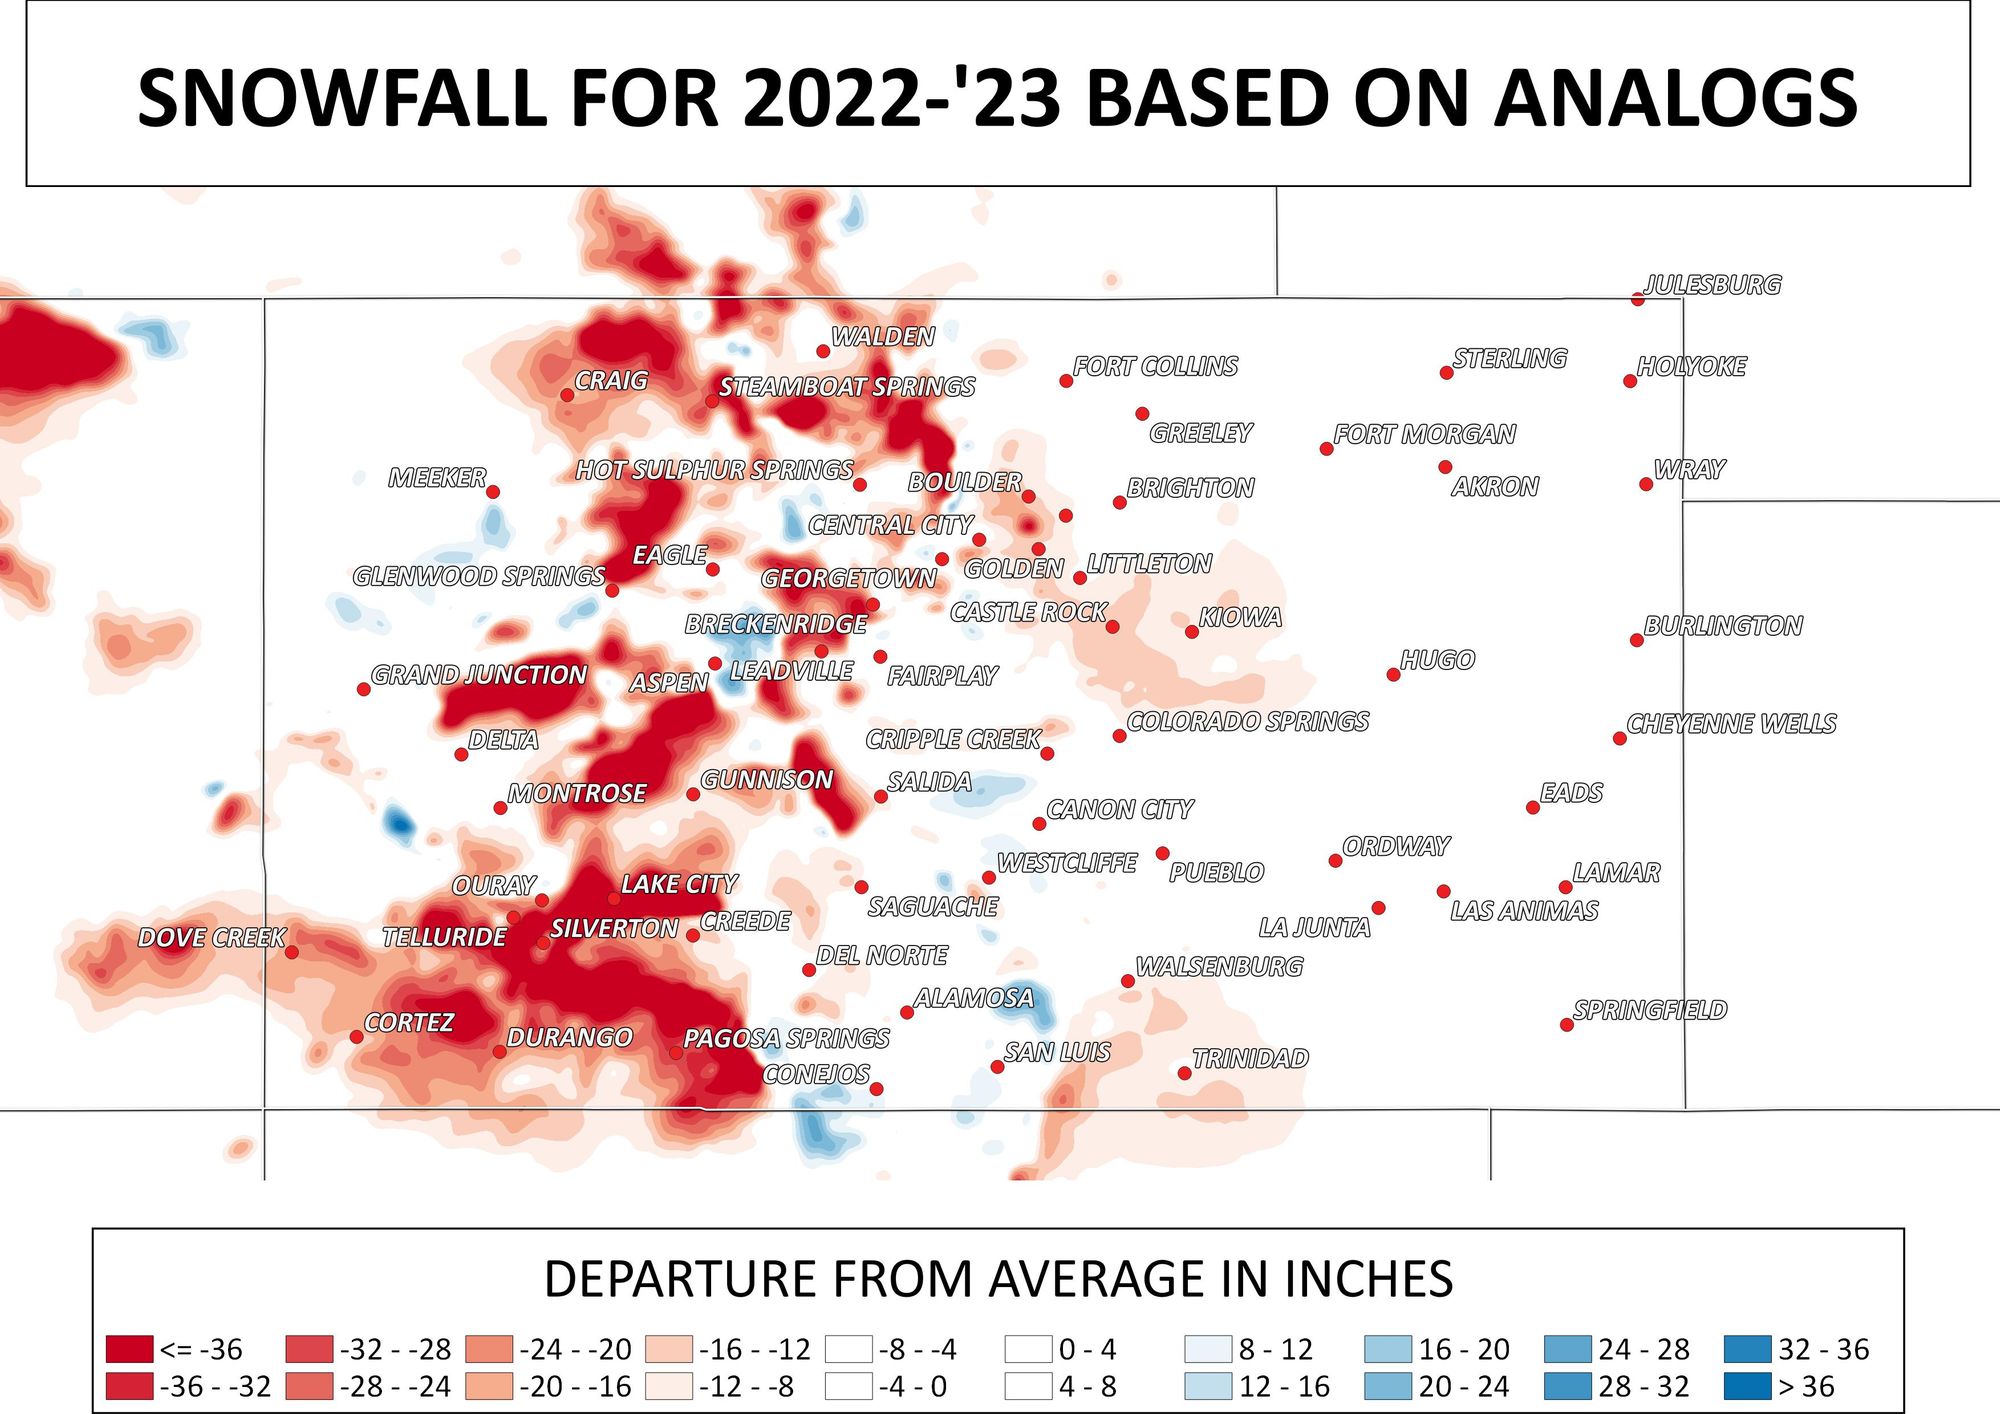
Granted one or two big storms would totally wreck this outlook, particularly on the Palmer Divide which can easily get a big storm to ruin any projection.
Also, the mapping above is over the limited 2008 to present period (our climatological period for this post). The seasons for mapping are defined as the water year (October to September), so I'll follow that water year definition below.
There are analog year options that are occurred earlier so I'll bring those into the city estimates that follow. For these locations, let's compare the average snowfall per year versus what just the analogs' average is as well as the max and minimum value of just those best-fit years.
For Boulder, the analog mean is 80.5", considerably lower than the climatological average of 98". The max analog year is 97.6" and the min is 62.4" (so even the maximum amount from an analog year didn't reach the long-term average).
For Colorado Springs, the climatological average is 33.8" and the analog mean is 31". The max is 51.7" and the min is 13.5" - a location with a wide spread!
For Denver, more than half of the years used ended up below average with a mean of 43.6". The total spread is a maximum observed snowfall of 79.2" and a lowest year total of 25.7"; that's quite a spread and shows how variable our snowfalls are even in 'most similar' setups. Using DIA, the climatological average for this period of record is 50.2".
For Fort Collins, analog years ended up below average with a mean of 49.8" but the climatological average is 54.4", so that difference isn't by too much. The max is 75.5" and the min is 35.3".
In all cases, we certainly have the potential for some snowy locations albeit those are the outliers. The mean, in most cases is near to below average for the cities mentioned and as mapped above.
I think that is valuable guidance going into a season, clearly a lot will factor into the ultimate result, but for an annual snowfall projection made in September we do have this as a reasonable approximation to give a general feeling of where we are headed.
And, at the end of the day we sorted out the hype and do have a historical basis of a forecast to represent what past similar years have provided to the state. This applies the climatological approach to forecasting and offers some scientific guidance to a "winter" forecast.
Going throughout the snow season ahead, we'll have video forecasts and discussions made available to you to help sort out the data and snow forecasts given from our perspective. Stay tuned.
We have a lot to observe for the winter and spring forecasts. Much of that will be how the oceans setup this fall which will be telling of the pattern for the snow season ahead. We usually post a detailed outlook in October, and plan to that again this year. This post is our preliminary thoughts.