March Outlook: Temperature and precipitation pattern for the month

For many, March came in like a lion – as the saying goes. Plus, there's a lot of media attention on another "Polar Vortex" event on the way. So what does the remainder of the month look like? Let's take a look at the atmosphere recently, modeling, and my analog year comparisons to build out an outlook for the next few weeks.
First, the Polar Vortex doesn't hit us with anything. The Polar Vortex is a feature of the Stratosphere, miles above the surface of the Earth. When it changes behavior it can cause a ripple effect that may or may not cause changes to the atmosphere very near the Earth's surface.
During the past several weeks there has been evidence of a warming event in the Stratosphere that will correspondingly send cold to the Eastern U.S. We have been watching the entire atmosphere behave in a way which gives growing confidence in that cold hitting the U.S. this month.
Watch this simple animation I created of the 700mb level (give or take 10,000ft above the ground) and this is comparing the past four 5-day periods of ridges and troughing.
During the animation, watch as 20-days ago (4 Pentad Past) through the latest week (1 Pentad Past) shows an increasingly strong ridge (red colors) over the Northern Pacific and another ridge over Florida and the Southeastern U.S. During that same time, deeper troughing grows from Hudson Bay down to the Western U.S. (shown in the blue shades).
This is the lower atmosphere's trend toward amplifying the pattern over North America, which in turn allows sharply colder temperatures to be "grabbed" and forced from the Pole to the U.S.
There are multiple Indices used to track these atmospheric changes. I'll show you one, the Eastern Pacific Oscillation (EPO) forecast.
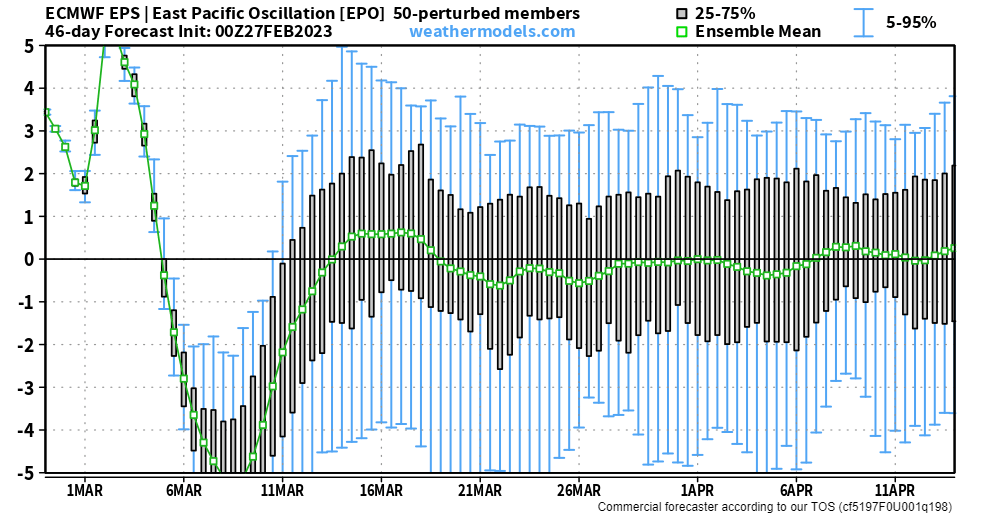
That sharp drop we see between March 6th and 11th is the amplification of and orientation of the ridge-trough pattern over the Pacific and western North America. This can also a good indicator of cold to be pulled into the U.S.
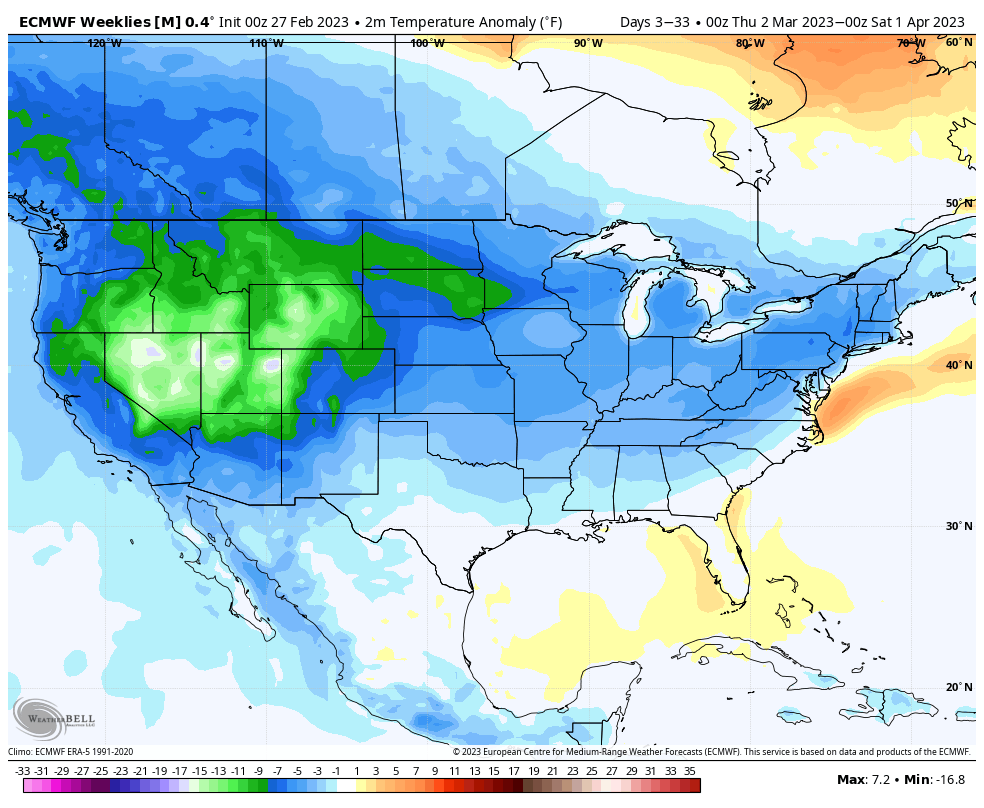
Let's see how the models handle this. Let's just look at the next two week's worth of surface temperature anomalies.
With the amplification already in place in the atmosphere, the model is then showing you how surface temperatures will change. Colder air (blues and purple shades) move in from Canada to displace the warmth across the South and then the Eastern U.S. This is, in part, the cold that is being touted as the, "next Polar Vortex to hit the U.S." It's not the Polar Vortex hitting us, it's the atmosphere doing what it does.
That animation goes through the 17th, so what happens next? We likely warm-up, but will it be enough to offset the first two weeks of the month...Here's the month's forecast from the same modeling group as above (European).
In total, this model believes we will have a cold month on tap (the Euro Weeklies product can have some issues at the longer-ranges, the weeklies rely heavily on the near-term and apply some persistence to the later weeks of the forecast and can somewhat 'bias' the weeks down the line with that persistence).
I still have concerns with that modeled-monthly forecast. The strength of the ridging over the Southeastern U.S. has been a factor during the past several months and hasn't been well handled in the modeling, in my estimation. The atmosphere suggests the first two weeks will be colder than normal before temperatures moderate for the second two weeks of the month.
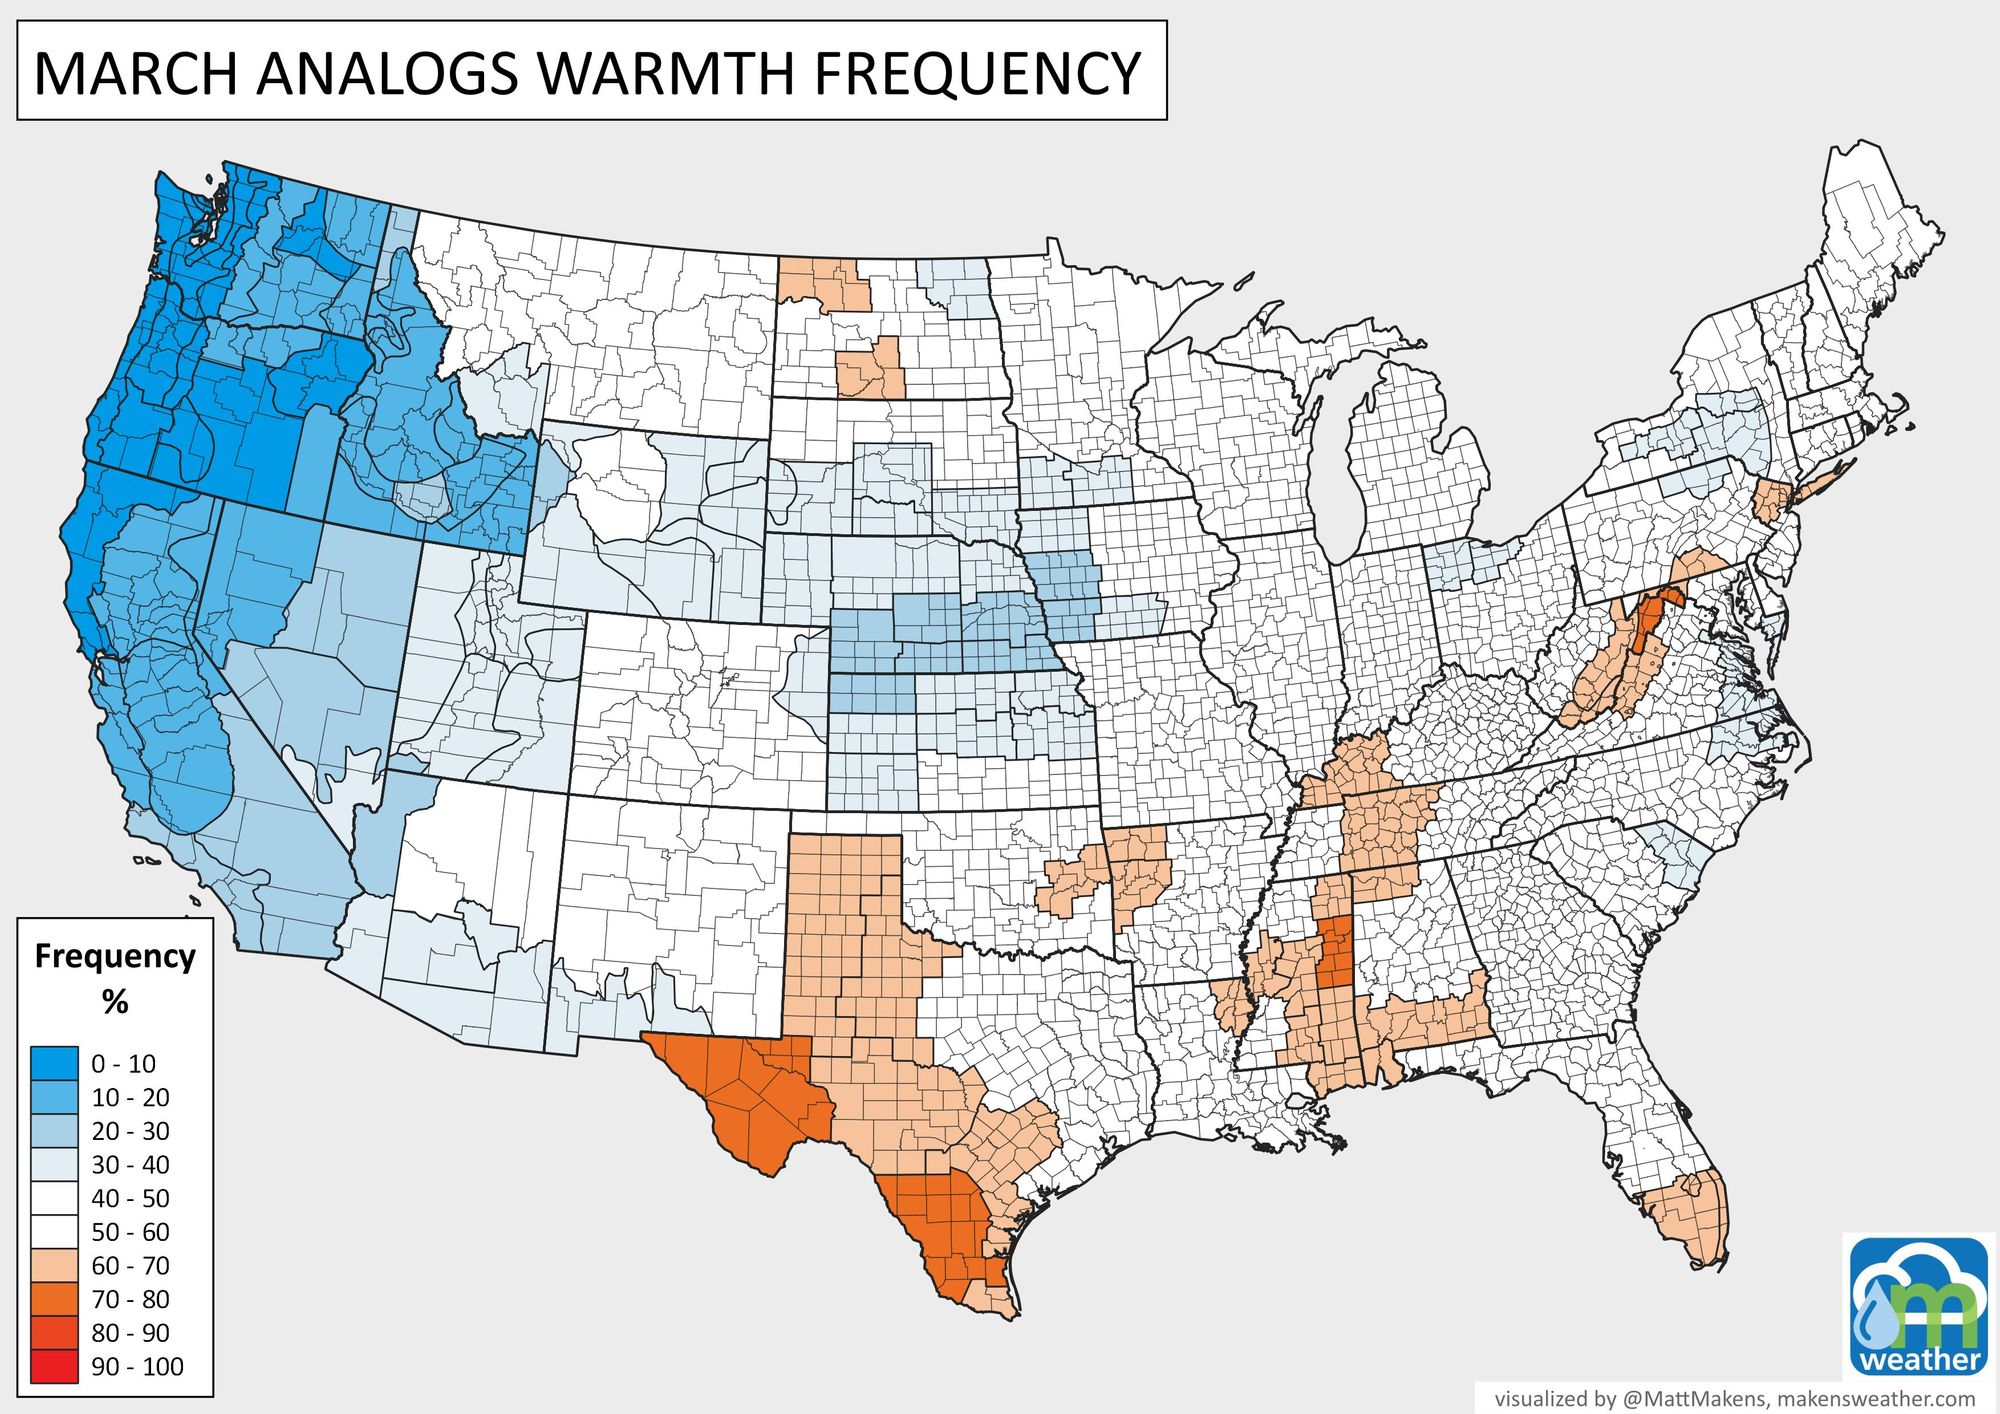
I'm going to show you how that element of the atmosphere is handled by the average temperature forecast of analogs when that ridge is strong, as it is now.
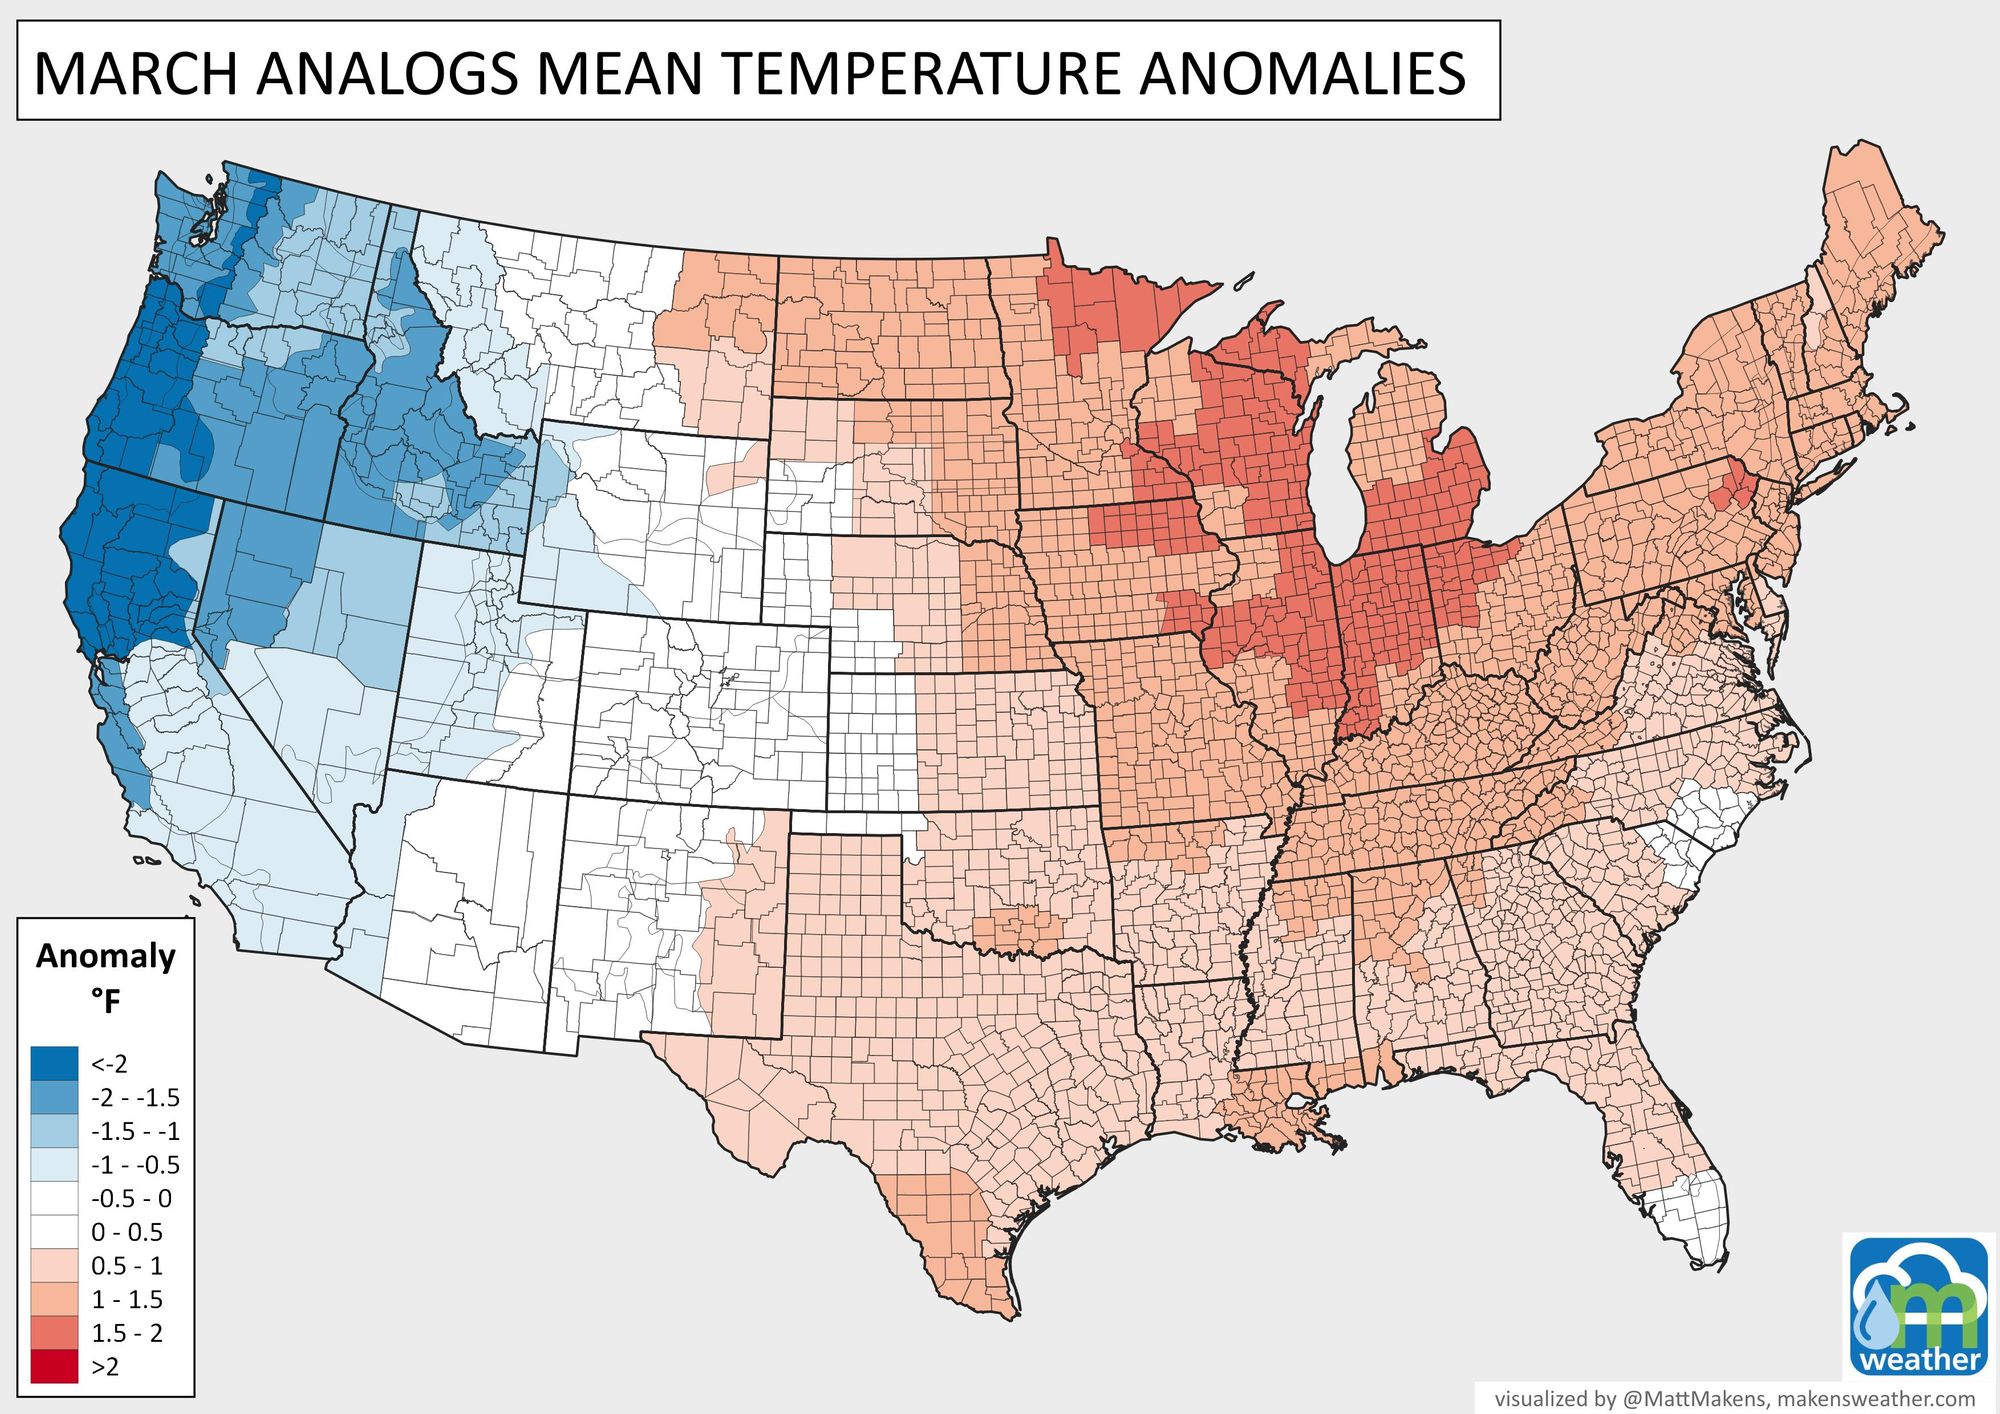
A ridge like that can have an offsetting impact to the reaches of the cold, and can support a much faster rebound during the back-half of the month for the Eastern U.S. I don't believe that the Northern Plains or Upper Midwest will see a warmer than normal month due to the snow on the ground reinforcing the duration of the month's cold snap. That map shows history suggesting a lower-impact cold event due to a very rapid warm-up to end the month.
So, considering the present, modeling, and history, where do I sit on the month's temperatures.
To help understand the longer period, I further dig into my statistical analytics on the atmosphere and ocean conditions and see the following compilations for the month, and would base a forecast with this in mind.
The West will be cold. The East, cold for a period before offsetting later in the month. In between, snow-packed areas will remain colder than average, but the Southern Plains will rebound.

That map shows us the frequency of warmer than normal temperatures based on 10 historic analogs. The West is never/nearly never warm in this setup, and there are areas from Texas to the Appalachians that are more frequently warm. However, there's a lot of neutral territory shown on that map. This doesn't do much to dissuade the monthly modeled forecast from above. That neutrality suggests to me that after the cold, we warm rapidly to offset the average temperatures by the end of the month.
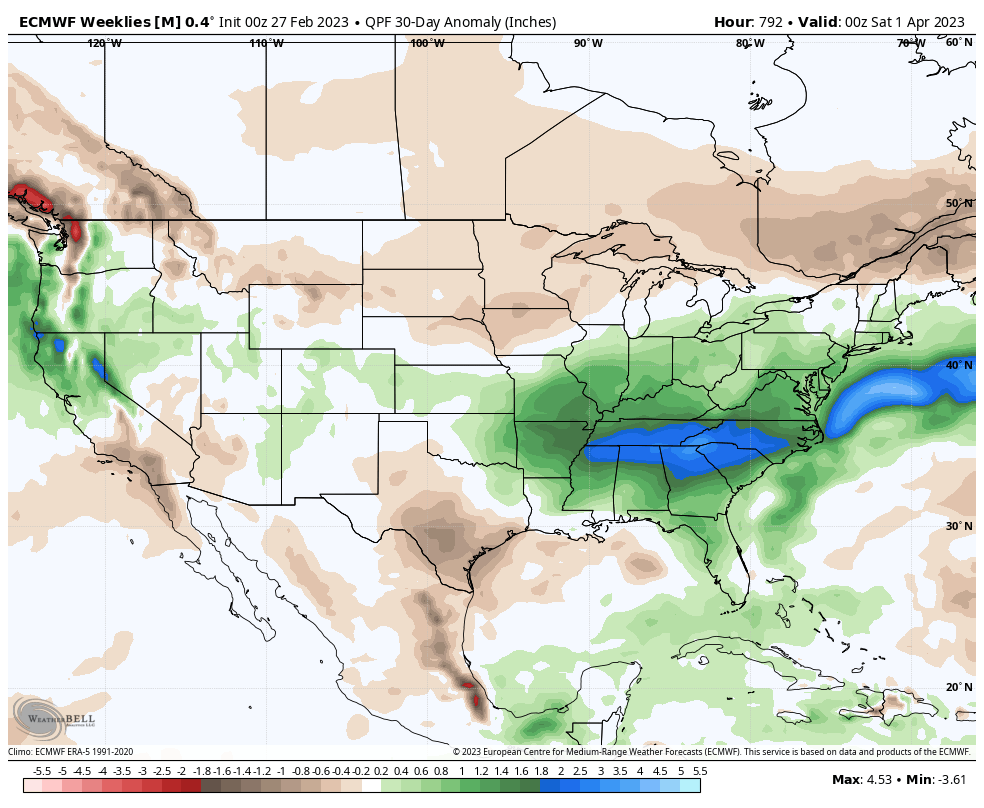
Okay, now, what about precipitation. These forecasts in March will always struggle (April's too) because one very strong storm will drop heavy precip and the forecast busts.
If you look at the models, most are in this camp which is wetness for the Southeastern U.S. and for the West.
What about history as a guide? My results are very similar to the models, but I do show an increased chance of heavy snow in the Dakotas and Minnesota as well as a stronger snow event to drop moisture over the Central Plains.
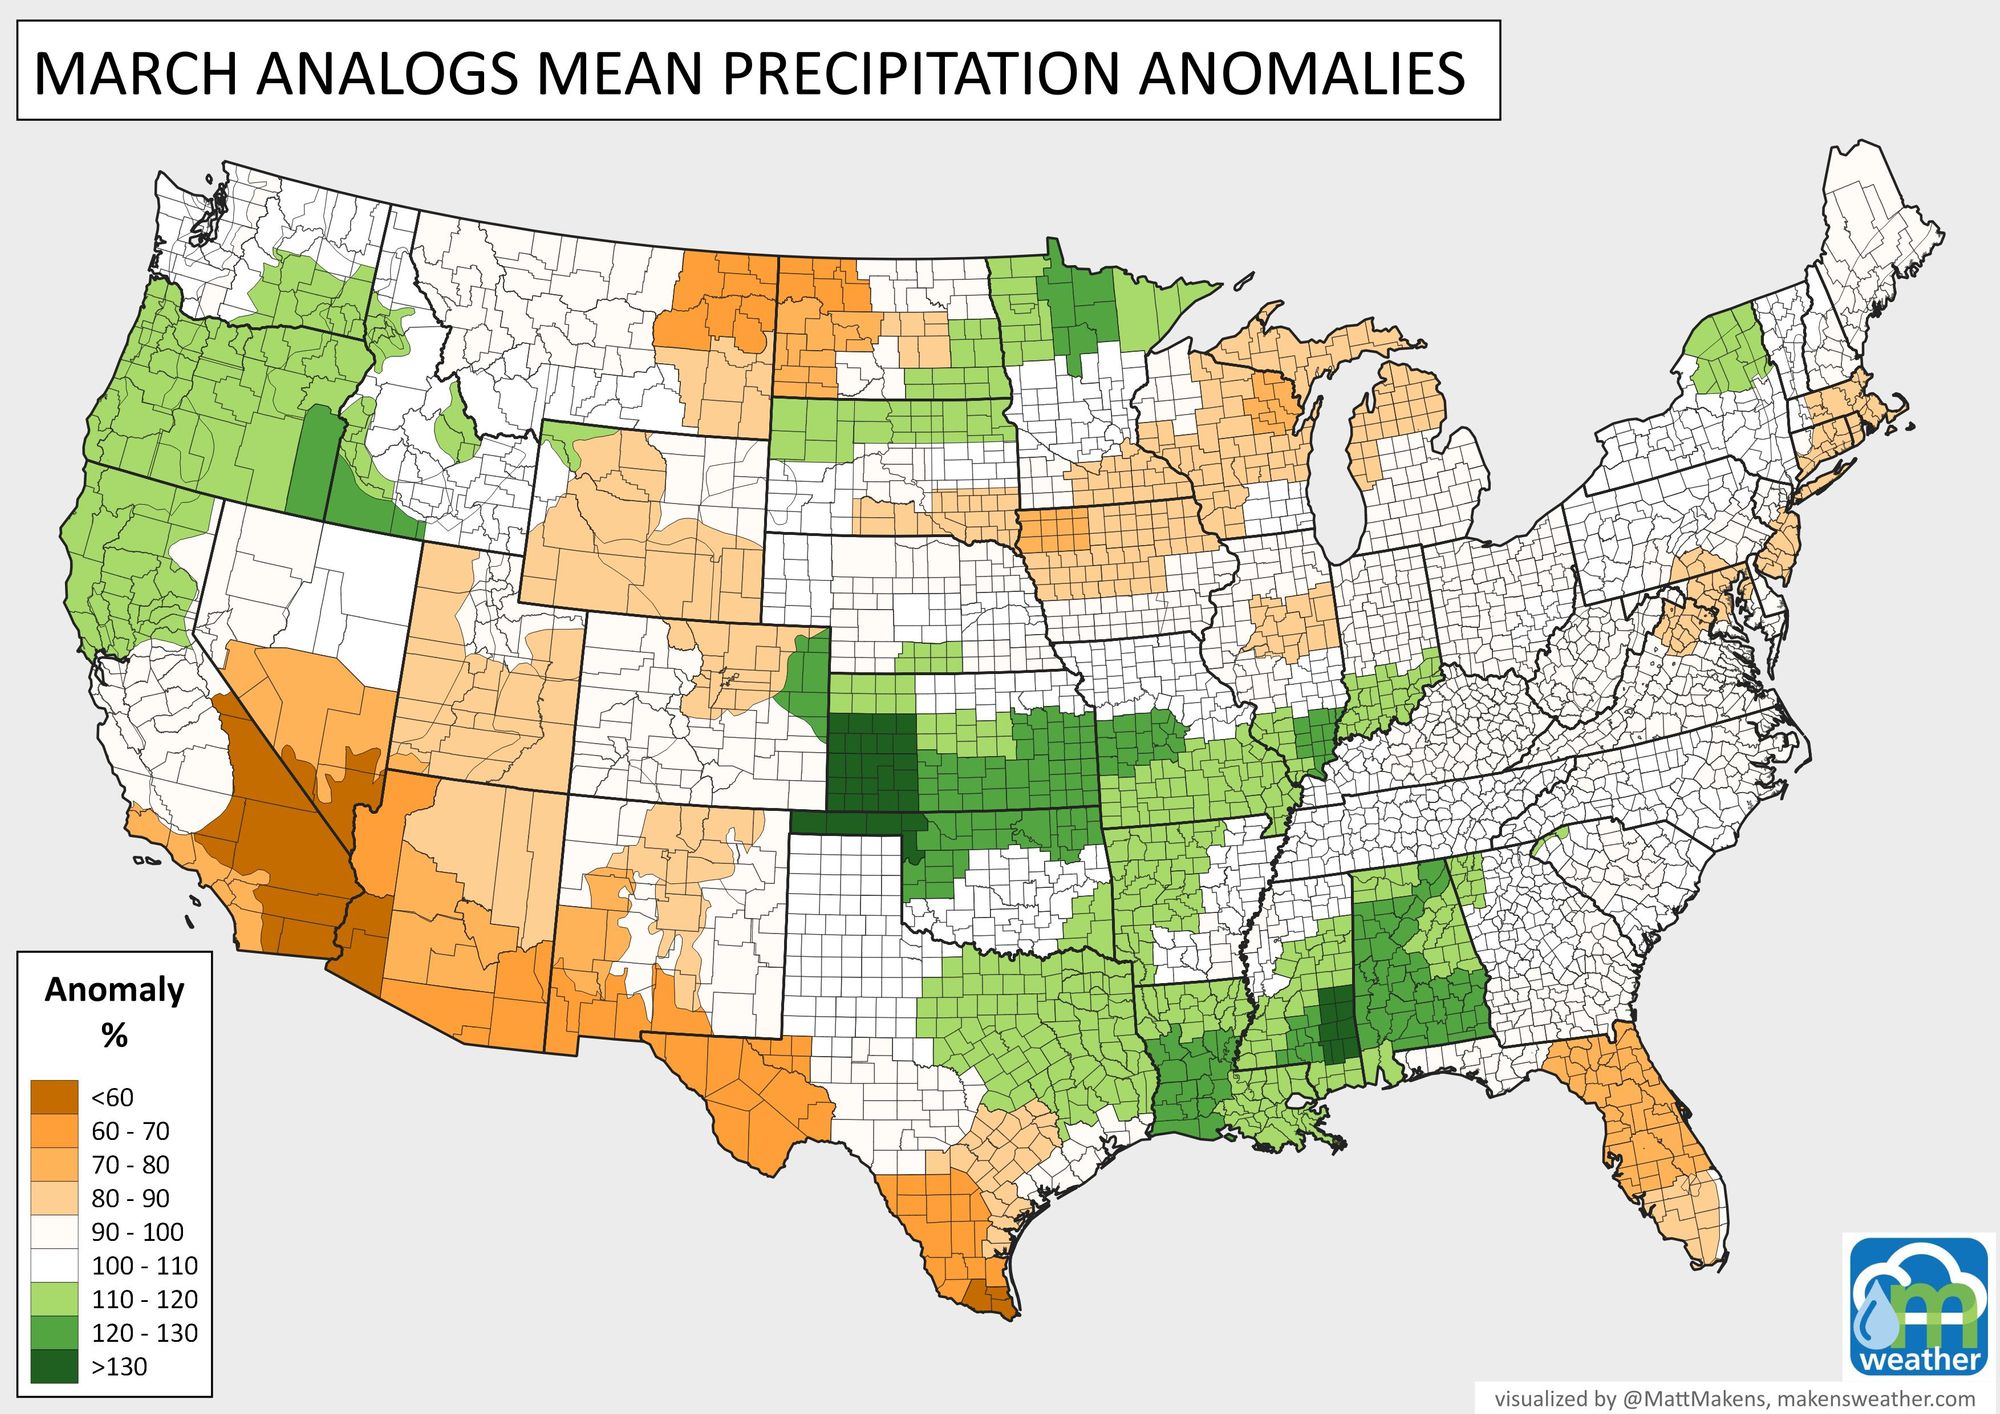
I think it will ultimately come down to the strength of that southeastern ridge and that will be the difference between my results versus modeling. Always a great adventure.
As we like to say here at Weather5280, "Don't get left out in the cold," – subscribe to our email list today – we send you an email when there's important information and Colorado forecasts to deliver.