La Niña and seasonal forecast update, January 2025

Time to check in with La Niña, and see what the latest status is and outlook as we move deeper into the new year.
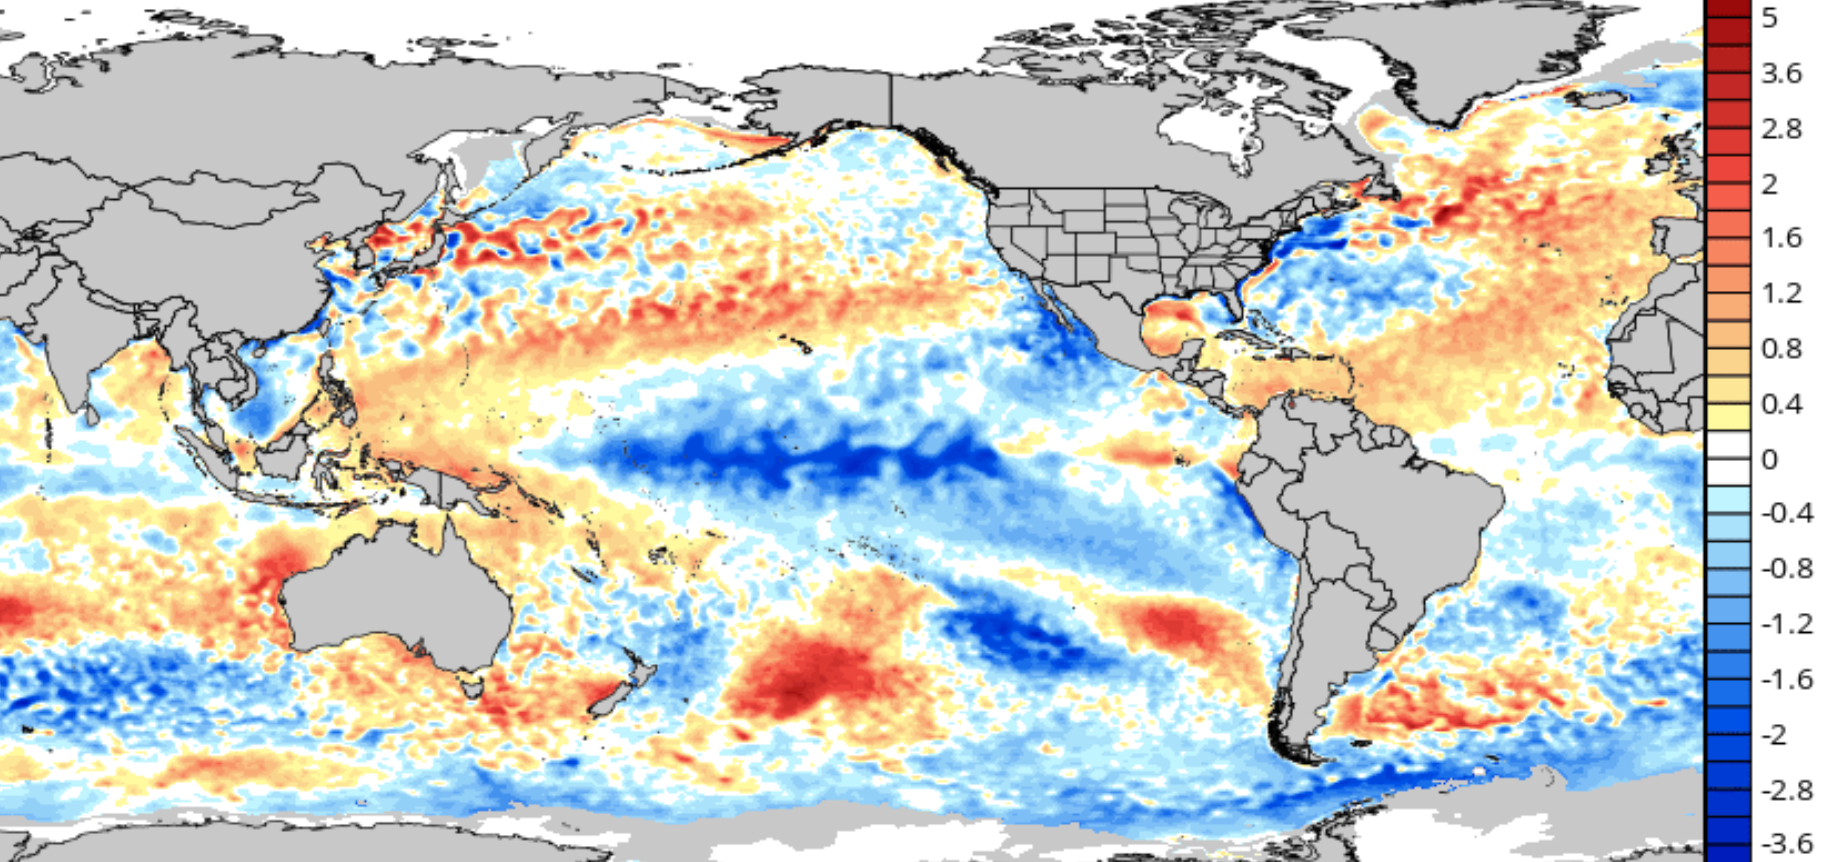
We often like to use a different metric than just the usual sea surface temperature anomaly map. The map below shows the difference between the current sea surface temperature anomaly and the global mean sea surface temperature anomaly.
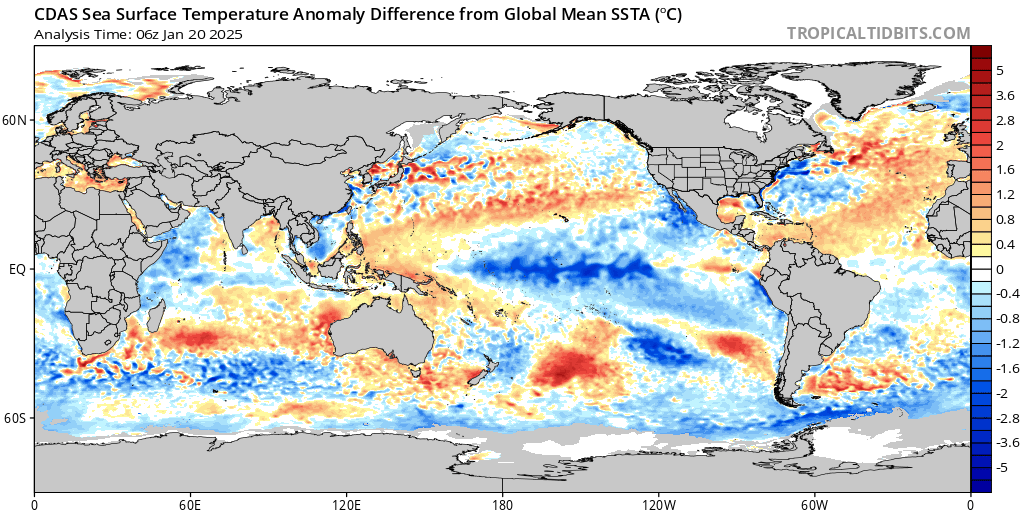
This metric actually gives one a better understanding of the strength of the current La Niña, as well as other "cold" and "warm" anomalies around the globe. As of right now, this La Niña is still kicking and focused mainly in the central equatorial Pacific Ocean. We can also look at it graphically, and see how this event has waxed and waned.
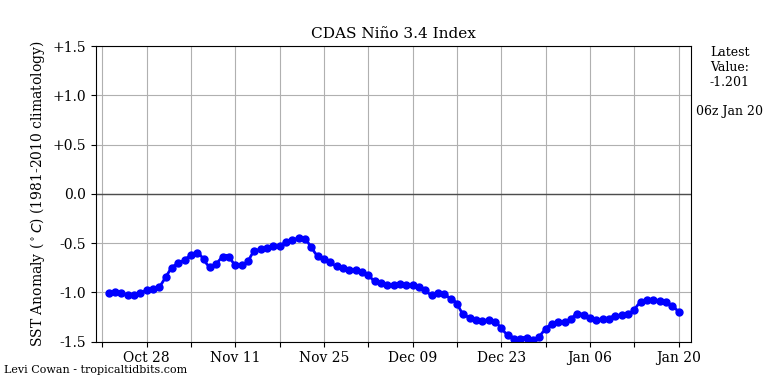
The above graphic tracks this La Niña back to mid October. You can see how it weakened to neutral levels in mid November, and then strengthened steadily and maxed out around Christmas. After Christmas, we've weakened it a bit... Will it continue to weaken, strengthen, or remain the same? The graphic below gives us a pretty good idea of what to expect for the next couple of weeks.
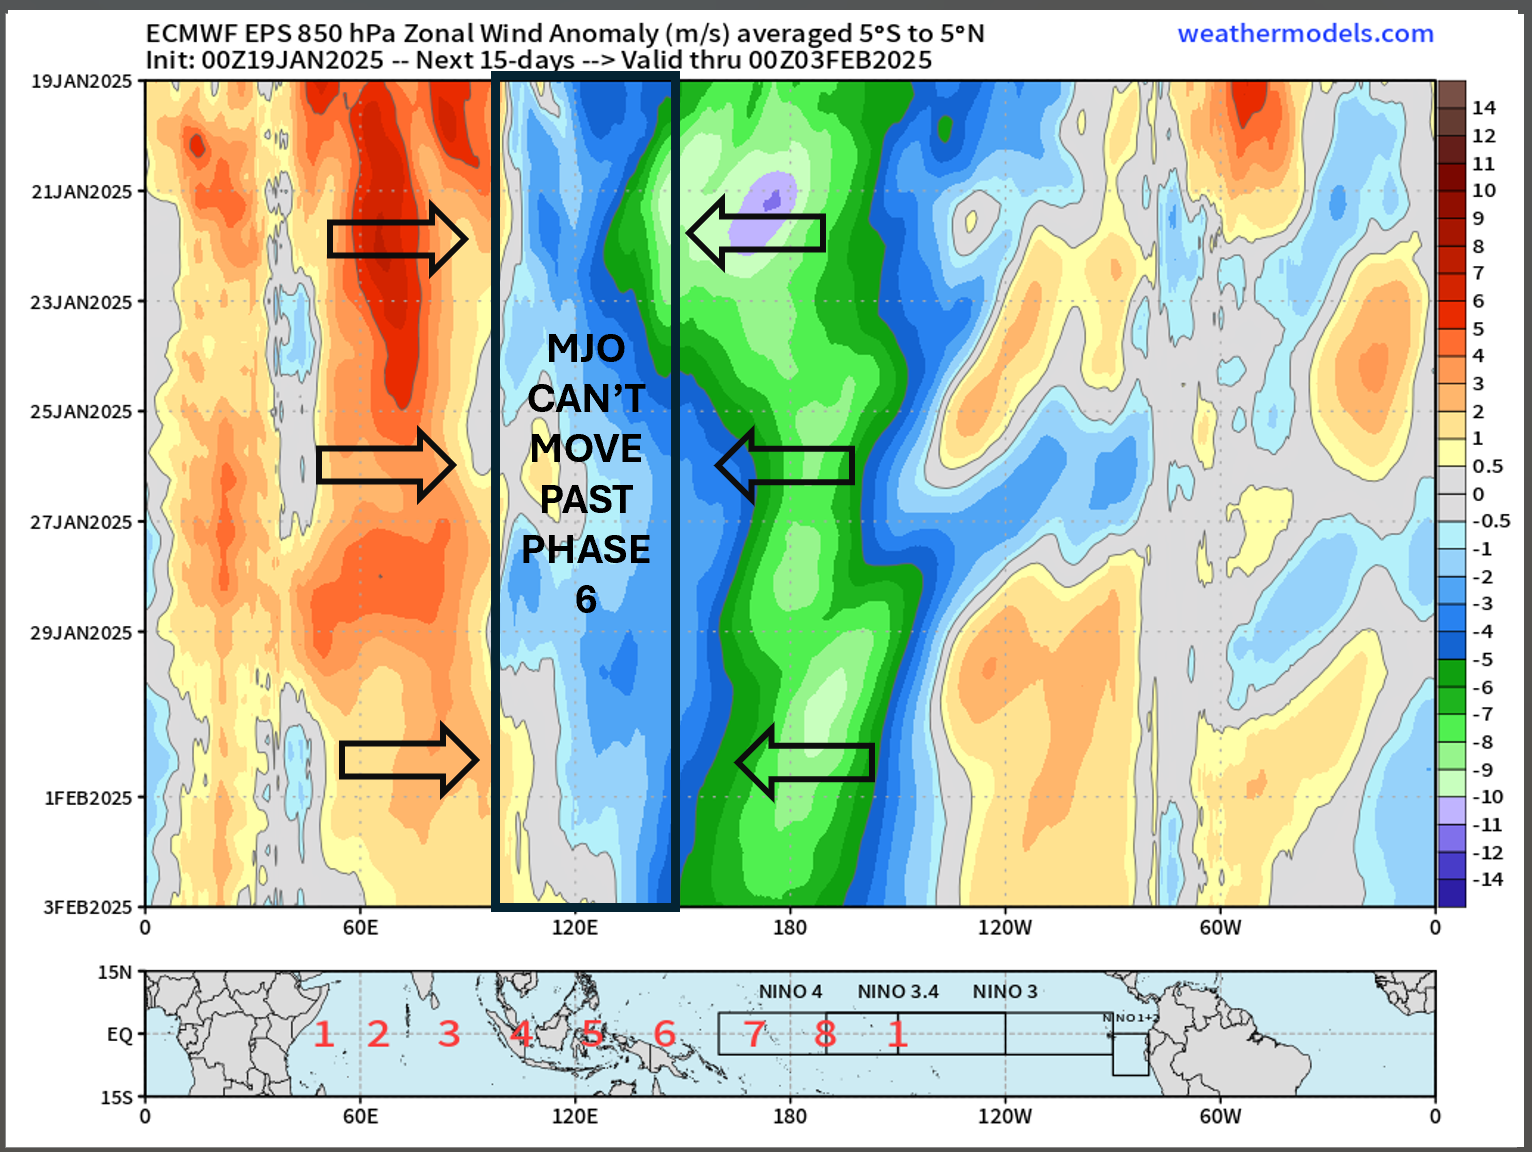
The blue/green represent easterly trade winds. The orange/red represent westerly wind bursts. Through at least the first few days of February, and likely longer, easterly trade winds along the equator will continue to be present. This will help maintain the current strength of La Niña and possibly even strengthen it a bit for a time. Nothing huge, but certainly maintenance of the on going Niña event. Despite this "maintenance" we continue to think this La Niña will weaken and depart before too long.
The current trade wind configuration also prevents the MJO from advancing eastward into phases 7 and 8. Those two phases usually make for active weather across the west/southwest parts of the country. Once those easterly trade winds weaken or go away, westerly wind bursts will advance farther east, and the MJO will be able to cycle farther east. This in particular will be very important to watch as we finish winter and enter spring. Ideally, we want those easterly trade winds to diminish in the coming weeks to help facilitate a more active and "meaningful" storm track for late winter and spring.
Seasonal Forecast Model Update
Before we get into the specifics regarding precipitation, I feel that it is important to show you what the prevailing upper level pattern will be for February through April. The animation below shows just that and is from the EURO Seasonal Model.
The blue represents areas of upper level low pressure, colder temperatures, and USUALLY stormier weather. The yellow/orange areas represent areas of upper level high pressure, warmer temperatures, and USUALLY quieter weather. Clearly, there appears to be a persistent area of upper level low pressure (blue shaded) area that dominates western Canada and the northwest US for February. That atmospheric artifact lingers through March, before gradually going away in April.
The main takeaways for me?
- Cold and snow will continue to build and be maintained in western Canada and influence the Northwest U.S.
- Fresh cold air will be able to be tapped by cold fronts that drop down from the north. This means that we'll have more bouts of significant cold air impact our own back yard.
- The main storm track will likely remain farther north. This will likely limit big moisture producing storms farther south for now.
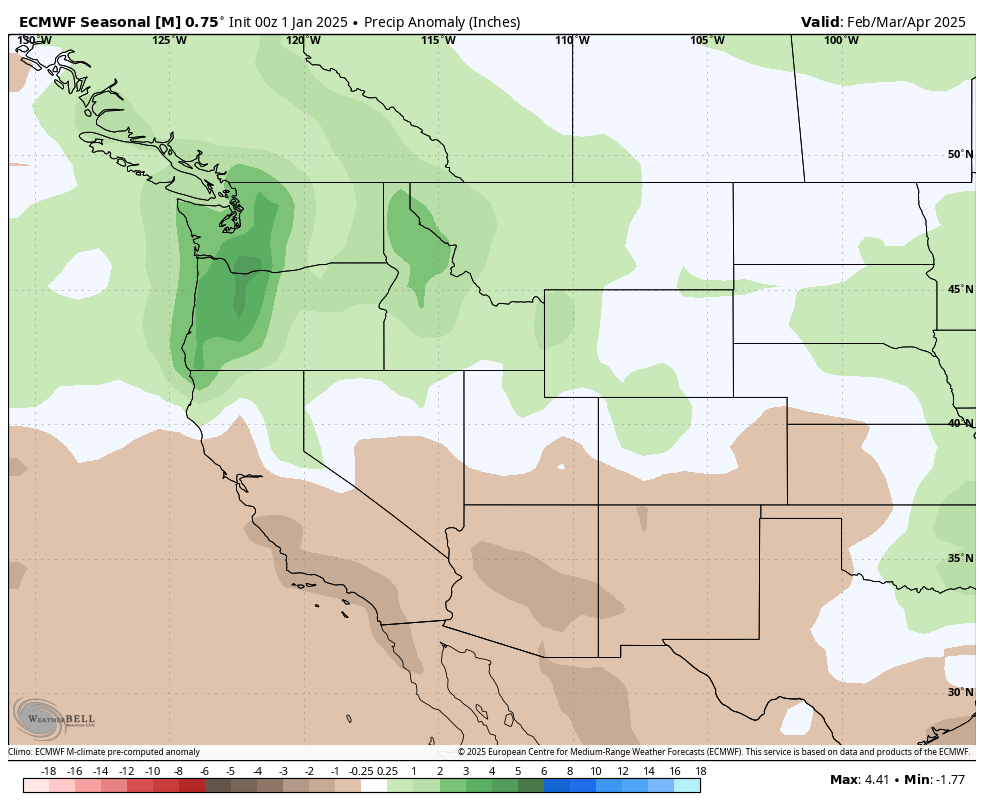
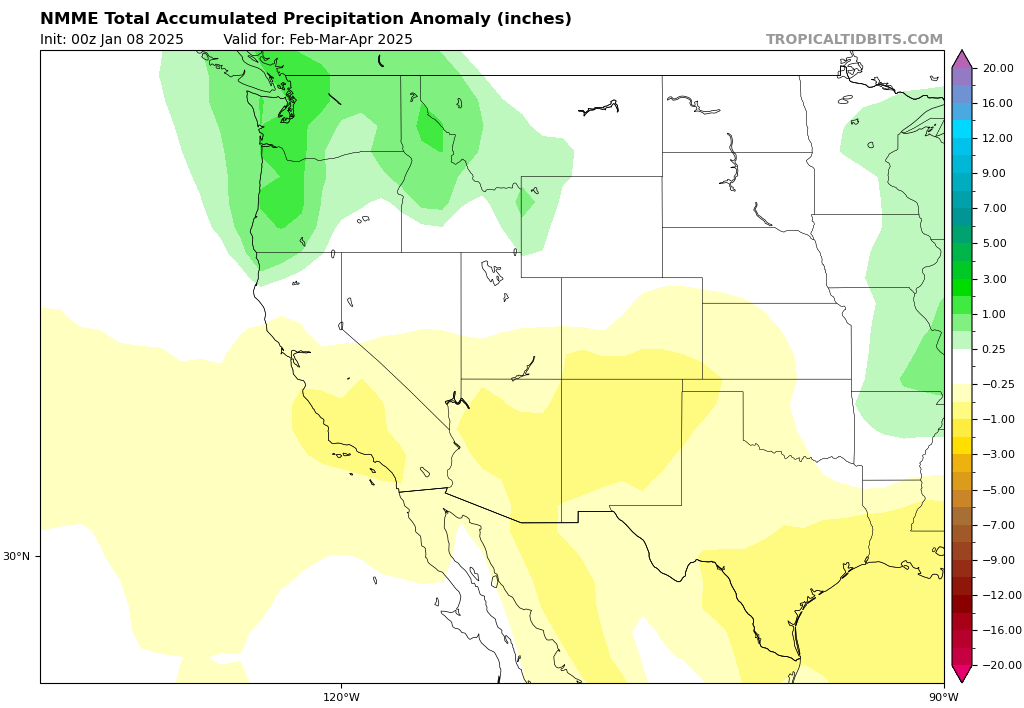
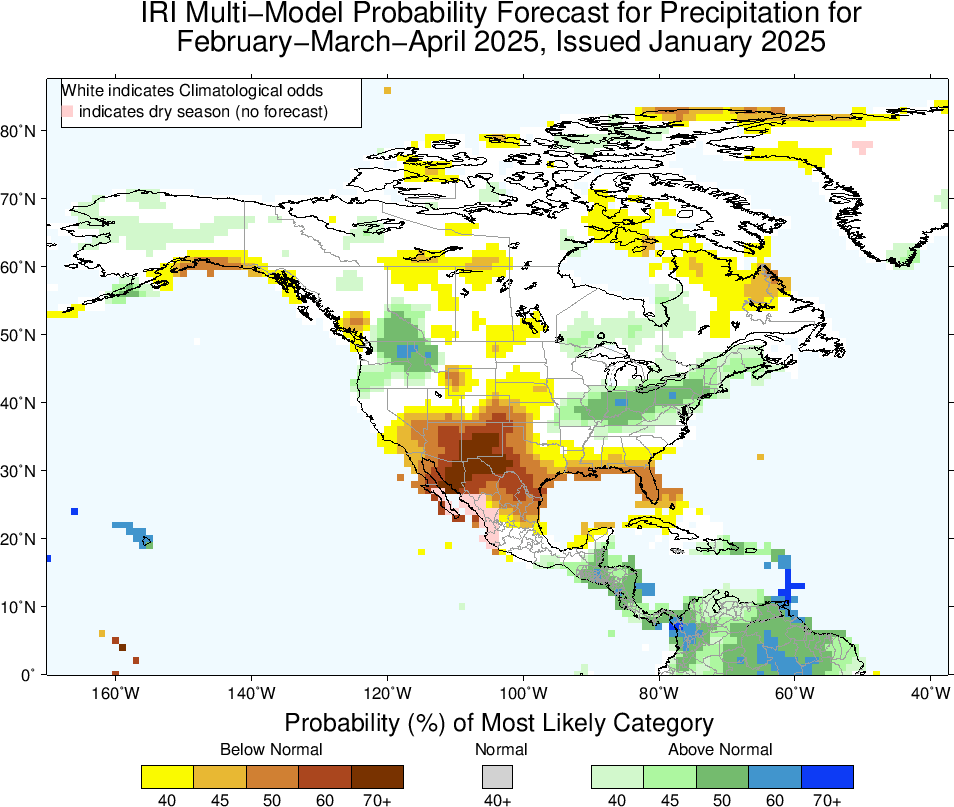
So, let's see if the various models are on board with that line of thinking... For reference, areas that show up as green/blue are forecast to have above average precipitation. Areas that show up as red/yellow/brown are forecast to have below average precipitation. The maps below show the forecast precipitation anomaly by each model from February through April.
EURO Seasonal Model Precipitation Anomaly Forecast
NMME Model Precipitation Anomaly Forecast
IRI Multi-Model Precipitation Anomaly Forecast
Climate Prediction Center Precipitation Anomaly Forecast
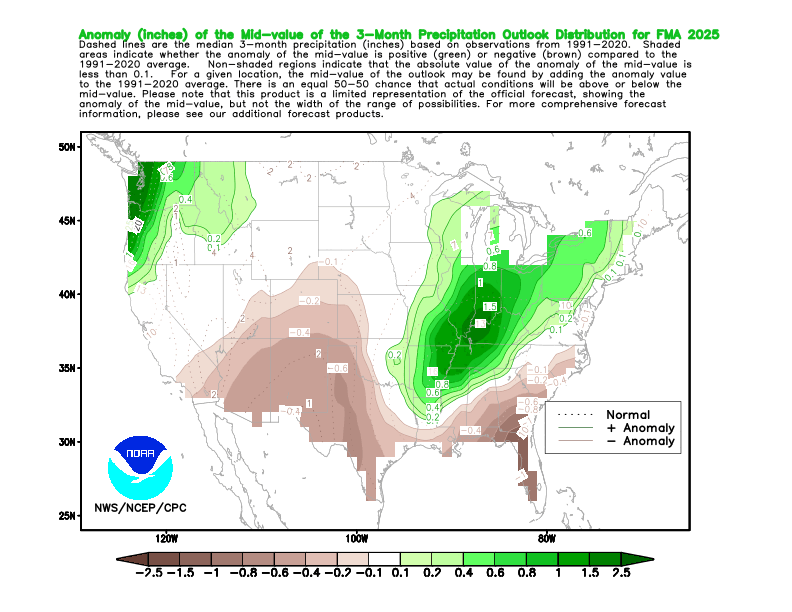
As you can see, all of the models agree on keeping much of the south/southwest part of the country drier than average. This is likely due to upper level pattern that prevails from February through April which was highlighted earlier in this article.
Now, this doesn't mean that there won't be storms coming through, it just simply means that the better moisture from those storms may end up farther north and east. I think it is also important to note that these models are not good at forecasting bigger individual storms. They are meant to forecast the general pattern. So, could we have a big storm that gives us a ton of snow? Absolutely...but, the overall pattern supports lower chances of an active pattern for us. Obviously, this is something we will continue to watch.