What is Conditional Symmetric Instability (CSI)?

When reading a National Weather Service forecast discussion during the winter months, we sometimes come across the term "Conditional Symmetric Instability (CSI)". This was true with our latest storm that is winding down today.
But what exactly is CSI, how can we diagnose it, and how does it differ from other phenomena that can dump multiple inches of snow in a localized area?
CSI involves heavy, banded snow that has a typical duration of 3 to 4 hours. These snow bands have a length anywhere from 100-400 km and have a width of 50-100 km, making CSI a mesoscale phenomenon.
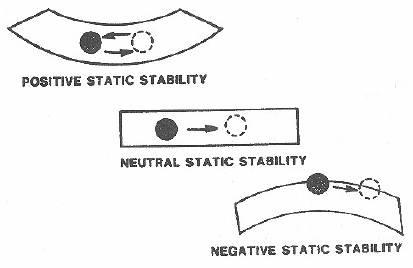
What makes CSI different from other forms of stability is that an air parcel is considered weakly gravitationally and inertially stable, but unstable when displaced in a slantwise direction. Gravitational stability, also known as static stability relates to the vertical displacement of air. When an air parcel is displaced in a statically stable environment, it will return to its initial position. In a statically unstable environment, an air parcel will continue to accelerate away from its initial position once it has been displaced. Lastly, in a statically neutral environment, an air parcel will remain in its new position after being displaced, but it will not continue to accelerate.
Inertial stability is the same concept as static stability, except it refers to the displacement of an air parcel in the horizontal rather than in the vertical.
A number of ways this unusual instability can be diagnosed:
First from a Skew-T diagram, the vertical profile must be at or near saturation. This is where the "conditional" portion of CSI comes into play. Also, note how the winds are turning clockwise, or veering with height. A sounding like the one below, if observed on the southern side of an upper-level jet streak, could be an area where the release of CSI is possible.
Second, plotting a cross-section could also reveal areas of CSI in the atmosphere. One constraint with this method is that the cross-section must be taken perpendicular to the thermal wind (average-layer temperature contour). This can be analyzed by looking at a 1000-500 mb thickness plot, and plotting a cross-section that is perpendicular to the thickness contours. The thermal wind is oriented parallel to the thickness contours. It is best to plot a cross-section with this orientation because heavy banded snow events caused by the release of CSI are oriented parallel to the thermal wind.
After determining the cross-section placement, we plot saturation equivalent potential temperature (theta-es) and geostrophic momentum contours onto the cross-section.
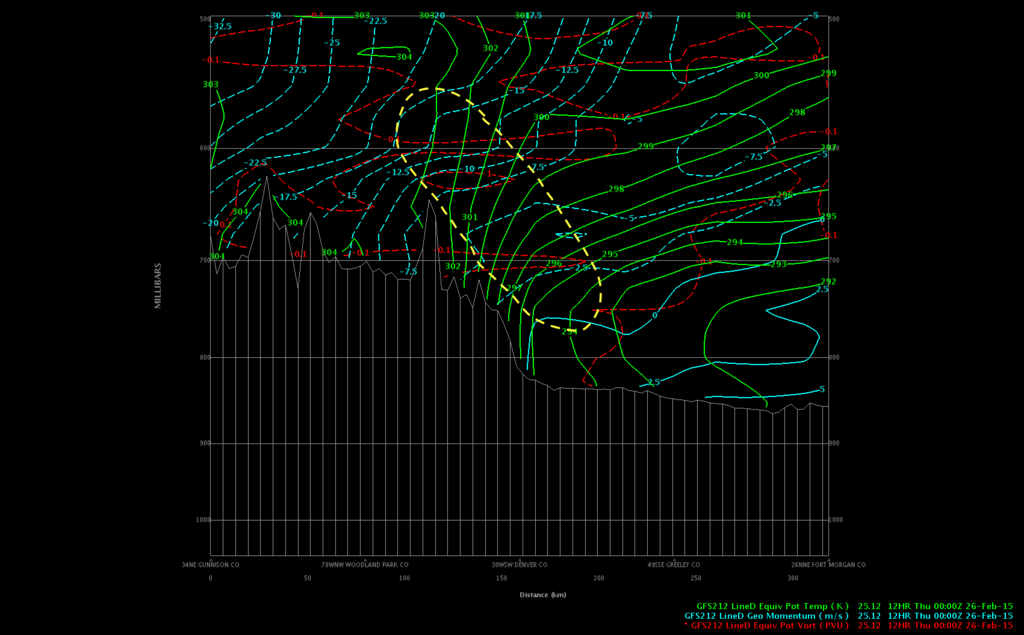
Saturation equivalent potential temperature is plotted because we are looking at a saturated profile. This value is defined as the temperature that an air parcel would have if it had its moisture condensed out, and then lowered dry-adiabatically down to 1000 mb, assuming a saturated profile. Condensation releases latent heat which warms the surrounding environment, while lowering this same parcel also warms the air because it is being compressed due to an increase in pressure. Geostrophic momentum is plotted because air parcels conserve their momentum. When diagnosing CSI, the theta-es contours must have a greater slope than the geostrophic momentum contours.
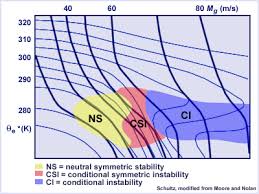
It is worth noting that CSI is not the cause of "thundersnow", mainly because the vertical motion associated with CSI is not strong enough to cause the charge separation that is needed to produce lightning. Thundersnow events are caused by the traditional upright convection, which is caused by convective instability (CI). CI occurs when equivalent potential temperature decreases with height. This can also be interpreted as having cold, dry air overrunning warmer, moist air. CI will always dominate CSI, due to it having a greater vertical velocity.
CSI usually occurs north of a warm front, where there is plenty of large-scale ascent. More precisely, CSI is most likely to be found within the right entrance region of a jet streak. Upper-level divergence occurs in this region, which enhances upward vertical motion. It is important that a lifting mechanism is present in order to release the CSI, as with other forms of instability.
CSI is a difficult phenomenon to diagnose and an even more challenging process to forecast. Although CSI might not be as dramatic as thundersnow, it still can catch many people by surprise by leaving inches of accumulation in a relatively short amount of time. Whether or not that is a good or bad surprise, that is for you to decide!