Perspective on Colorado's Snowpack: Is There A Downward Trend?

Matt Makens is a KWGN Pinpoint Meteorologist and occasional contributor to Weather5280 from Denver's Pinpoint weather team.
It's the time of year when we look at the snowpack numbers to climb, and hopefully stay near to above average for water resources, fire danger, and the economy; so far, so good.
Here is the average snowpack chart for Colorado showing a nearly normal curve until the past week or so:
In this analysis, I was curious to look at how Colorado's snowpack has changed over the years, if at all.
Since the early 1980s, the data shows that the state has a dropping snowpack year-to-year and the trend is matched in the total precipitation data.
However, there are a lot of annual variations, as one would expect. Plus, recently we've seen a much higher June snowpack versus what is average.
The Data
I'm simply using the SNOTEL data provided by the Natural Resources Conservation Service (NRCS). This data comes with the following caveats as detailed by the NRCS.
- All values below use medians calculated with the most recent 1981 to 2010 normals period.
- Each year and month frequently varies slightly as to the exact sites that are complied to provide the basin-wide percent of median.
- A minimum of 5 observations were required in each of the basins for each value below to provide a level of statistical significance.
- All percent of median values above 500% have been removed.
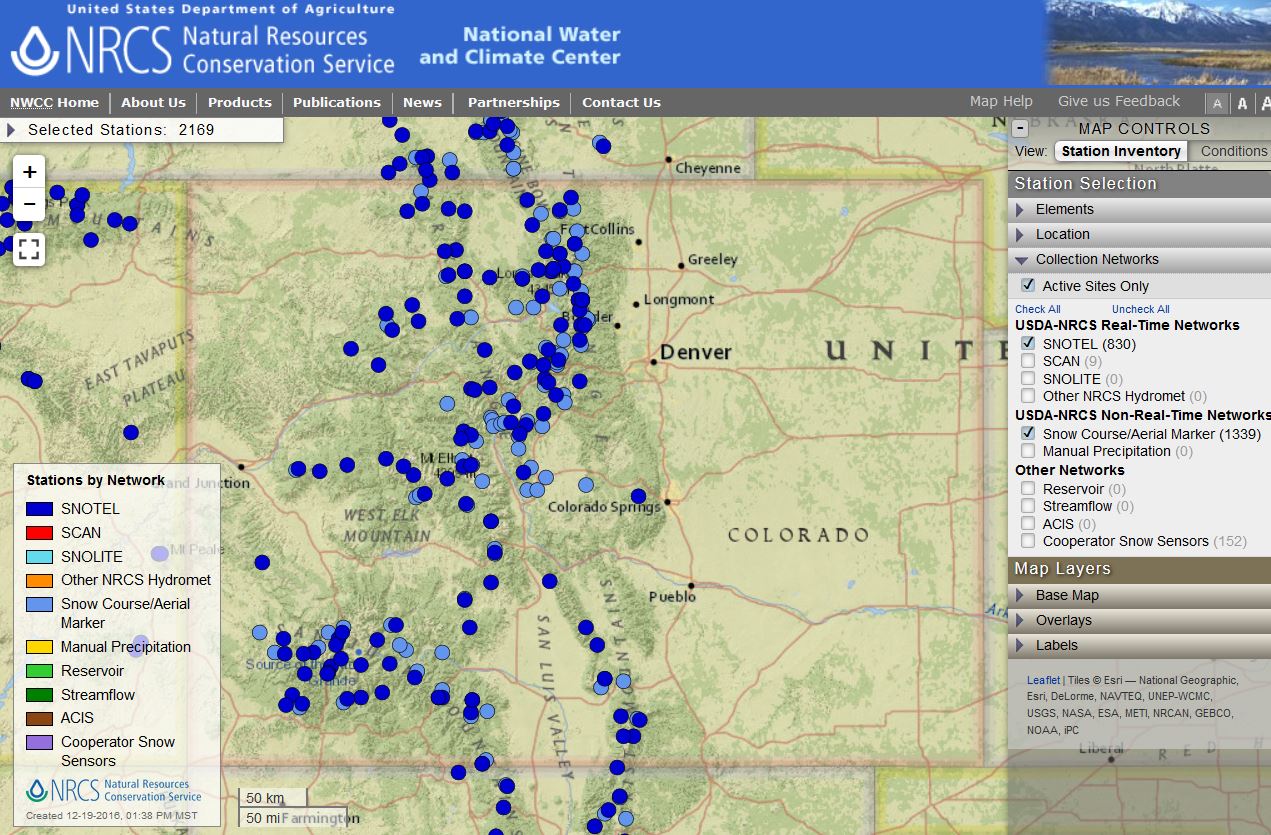
Here is a map showing locations of SNOTEL sites as of now; a nice coverage. The network has grown over the years which presents some limitations prior to say the early 1980s.
I've taken the monthly snowpack percentages (January through June) and the yearly snowpack average from the NRCS website for the following.
Edit 11-30-2017 1:22pm, per a reader's question. SNOTEL is not the only type of weather station data used in this analysis. It is since the late 1970s the dominant source. Prior to the 70s there were other snow stations used, SNOW per NRCS. It should have been more clearly noted that I used NRCS data from a variety of stations with varying periods of record and not just SNOTEL sites.
The Analysis: Yearly Snowfall
I've chosen to start with 1981 as it is the starting year of the 30-year period of record used as their "normal" baseline. I'll show you total years shortly.
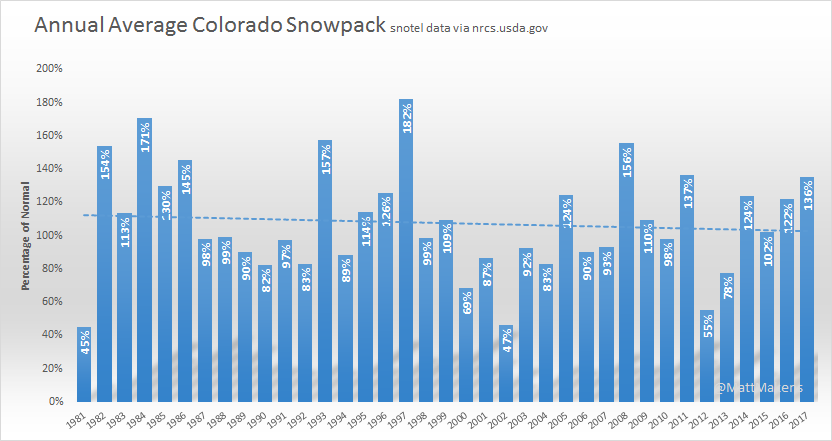
Granted, the decline since the 1980s is not what I would call steep, but offers some indication of less snowpack year to year. (This is a simple trendline analysis and does not include semi-decadal fluctuations in ENSO or PDO phases which I will elaborate more on shortly.)
I should note that I'm using a simple linear trendline. This isn't the best approach to analysis as a linear trend does not occur in weather. Alas, it's a quick visual to the dropping snowpack numbers. The same trend is found if taking multi-year averages and comparing over the run of the data; still a negative trend.
Let's compare that trend, to the trend in the entire run of the data, going back to the 1930s.
Here it is in total and the data shows no appreciable decline in snowpack since this record began, suggesting decadal or multi-year variations not present in the shorter time spans:

The Analysis - Monthly Snowfall
We can take this further. Let's see how each month has reacted.
Here we have January through May, also with simple trendline analysis. And, using all data records available per month; period of record varies as you'll see.
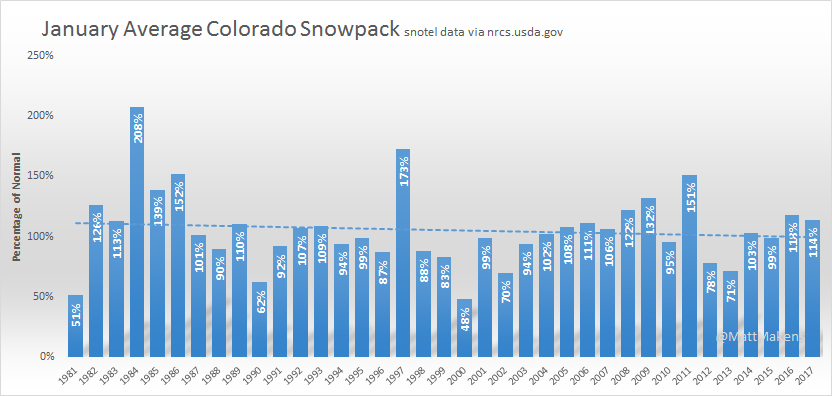
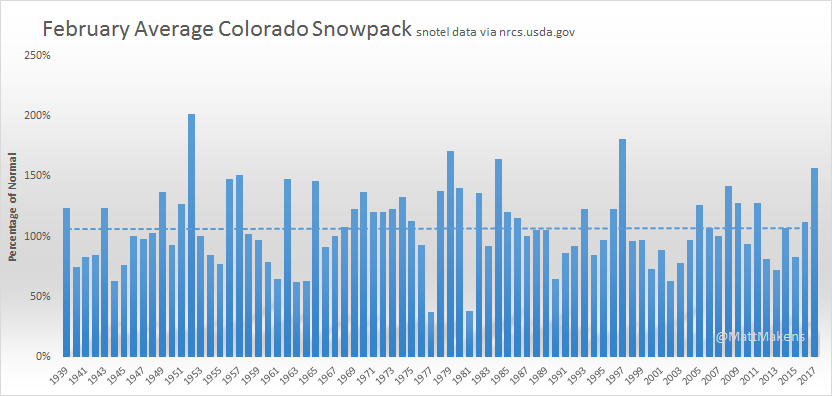
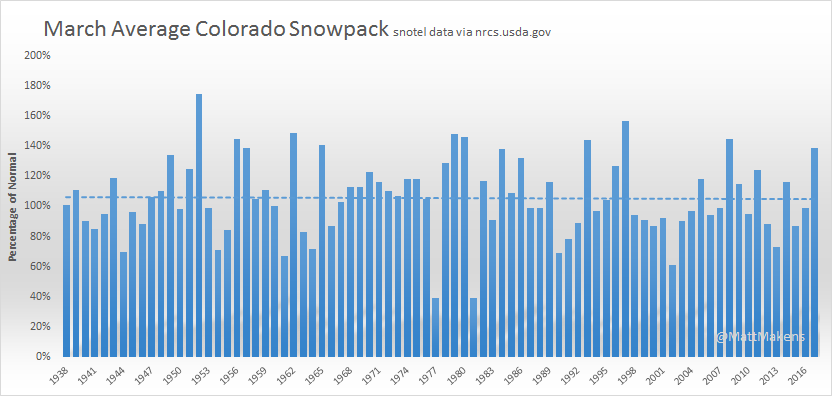
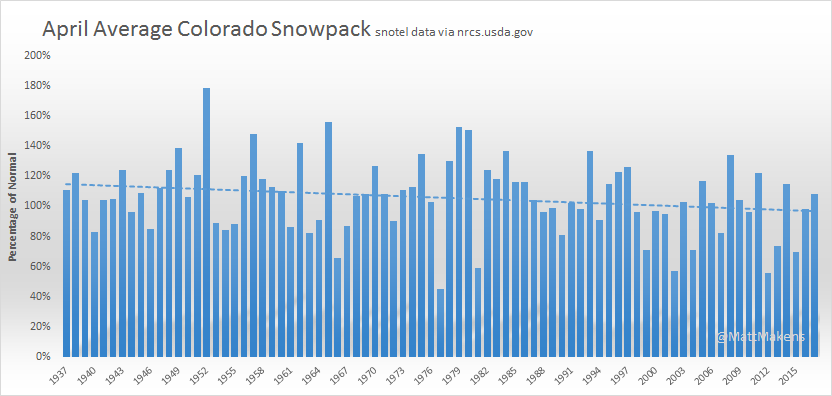
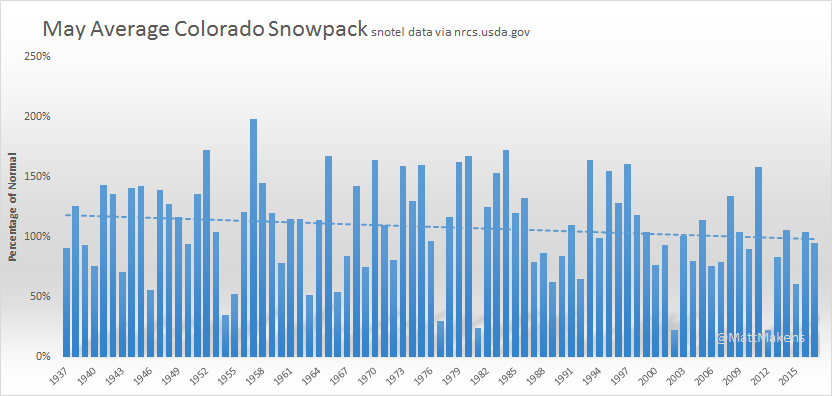
As you can see, the total data trend is running with little change in February and March. Yet January, April, and May have shown a more notable snowpack decline.
Per the April and May numbers, does this mean that we are having less snowfall or just less snow sticking around due to warming decadal temperatures? The easiest approach to that question is to look at the total precipitation measured at the same sites.
Let's look:
The Analysis - Monthly Rainfall
I'm taking the same SNOTEL data as above but for total precipitation this time. Looking at January to May.

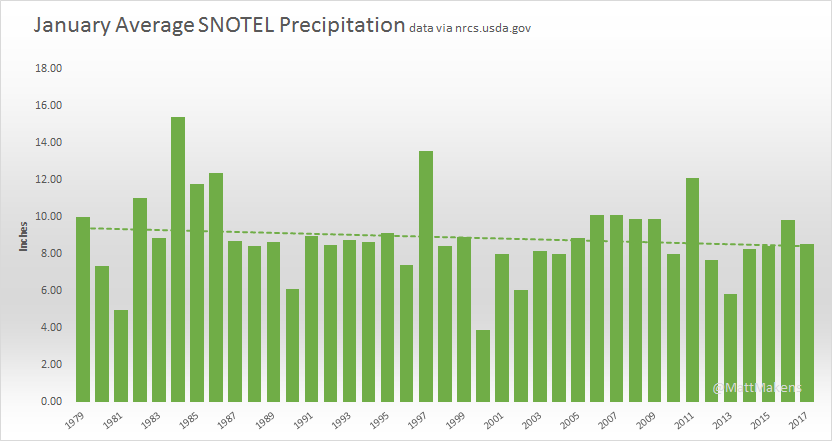
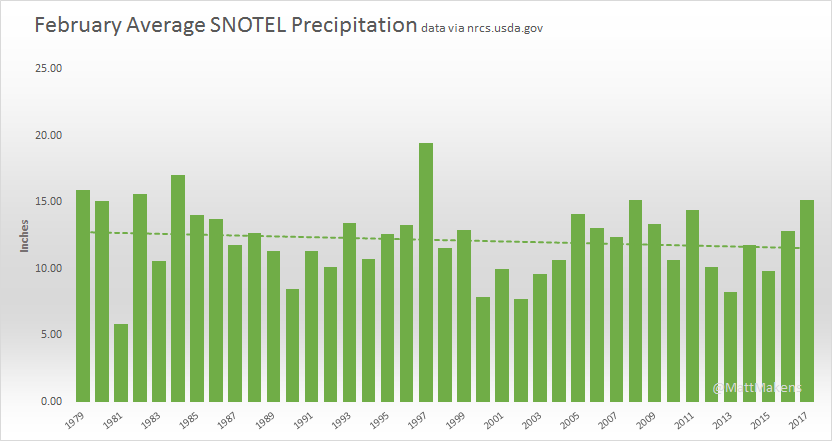
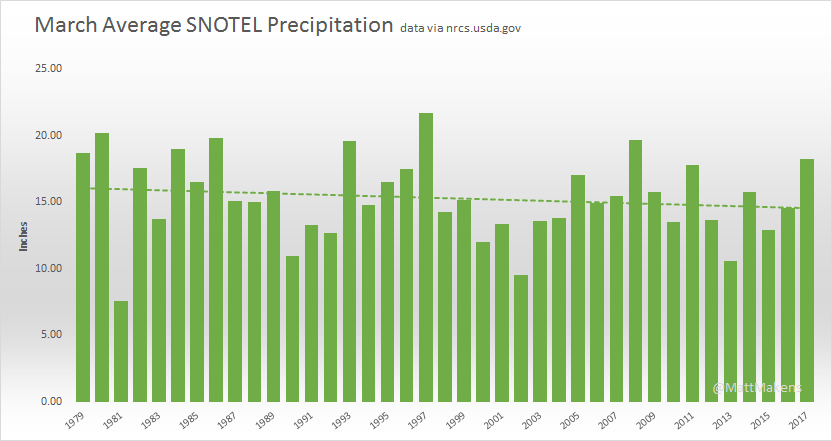
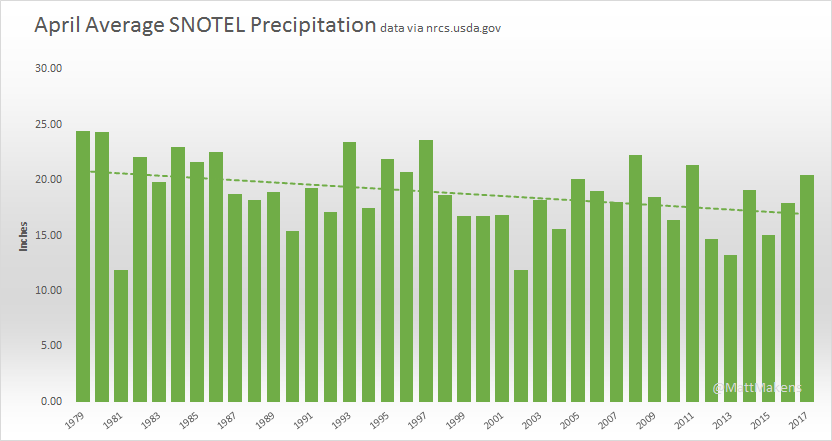
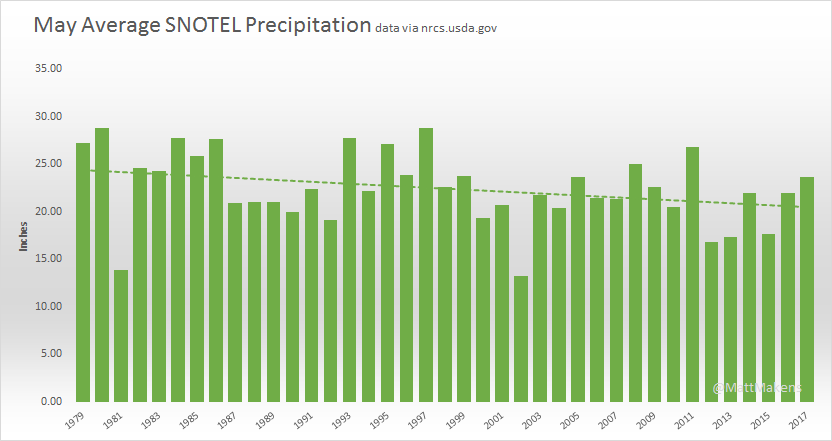
In all cases, there is a downward trend of precipitation. Note, the SNOTEL precipitation data records go back to 1979.
I won't bore you with the graphs, but I compared 1979 to 2016 rate of decline in total precipitation and snowpack for the months. The total precipitation is roughly 88% of what it was in the early 80s/late 70s, and the snowpack is roughly 83%. Based on the simply crude approximation, the rates are roughly the same.
The Analysis - Temperatures
No, it doesn't appear that the mountains are getting more rain in lieu of snowfall - both are declining. This means we cannot assume that a dropping snowpack is due simply to a warming trend.
Speaking of which,
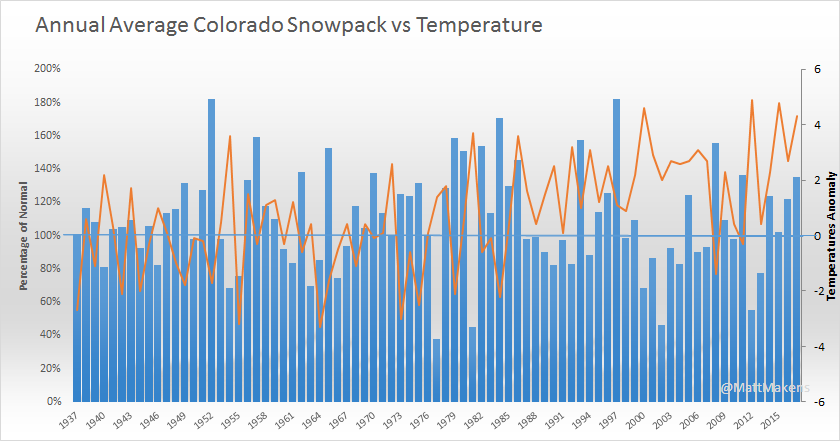
The temperature anomaly shows a warming trend since 1937. The snowpack is a flat trend in that same time. Temperatures seemingly have no correlation to our snowpack to date.
To re-emphasize the point, let's look at June snowpack. Here are all years available:
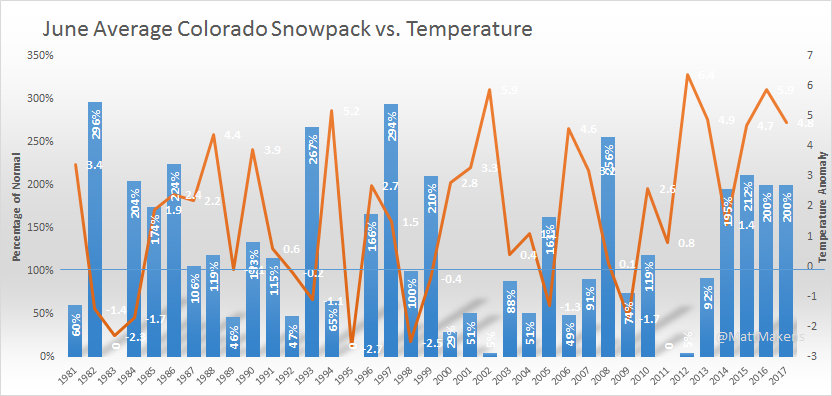
Just look at the last four years! Incredible snowpack, double the average, despite including two of the warmest Junes since 1981.
This certainly isn't enough to say that warming temperatures aren't impacting late-season snowpack, but the correlation at this time appears low. I suspect that warming temperatures must hit a critical point before we see an impact in losing snowpack.
To this point, I have only spoken on local temperatures at the snowpack sites. However, let's broaden the scope of regional temperatures and a broader change to our overall storm pattern.
The western & Southwestern US - including California, Nevada, Utah, Arizona, New Mexico, and Colorado - have experienced increased drought frequency as this region's temperatures have increased with decreasing precipitation for several decades.
However, the region including Wyoming, Montana, North & South Dakota, and Nebraska have had an increased precipitation rate with lower drought frequency despite warming temperatures. This tells me there is a regional pattern effect occurring.
On our regional scale, we clearly have a drought situation and the feedback loop drought and temperatures create together. On a broader scale, we don't see that same issue to the north. It's likely that the warming temperatures locally, regionally, etc. have caused the main storm flow to move to the north – which makes sense from the basic principle of what causes the jetstream's position.
Looking into this theory has much support in the research community. There are a number of projects that have focused on the northern shift of the jetstream over the decades. Just an excerpt from one example:
Jet streams twist and turn in a wide swath that changes from day to day. The poleward shift in their average location discovered by the researchers is small, about 19 kilometers (12 miles) per decade in the northern hemisphere, but if the trend continues the impact could be significant. “The jet streams are the driving factor for weather in half of the globe,” says Archer. “So, as you can imagine, changes in the jets have the potential to affect large populations and major climate systems.” The observed changes are consistent with numerous other signals of global warming found in previous studies, such as the widening of the tropical belt, the cooling of the stratosphere, and the poleward shift of storm tracks. This is the first study to use observation-based datasets to examine trends in all the jet stream parameters, however. “At this point, we can’t say for sure that this is the result of global warming, but I think it is,” says Caldeira. “I would bet that the trend in the jet streams’ positions will continue. It is something I’d put my money on.”
-Cristina Archer and Ken Caldeira of the Carnegie Institution’s Department of Global Ecology tracked changes in the average position and strength of jet streams using records compiled by the European Centre for Medium-Range Weather Forecasts, the National Centers for Environmental Protection, and the National Center for Atmospheric Research.
In an effort to confirm this finding on our local pattern, and of course to shed light in this blog's analysis, I need to find the frequency of storms going back historically and find a negative trend there also.
I started looking at individual SNOTEL stations for the frequency of measurable precipitation events. Surprisingly to me, those sites that I started with showed an increase in frequency or no change at all...humph, well isn't that something. One example:
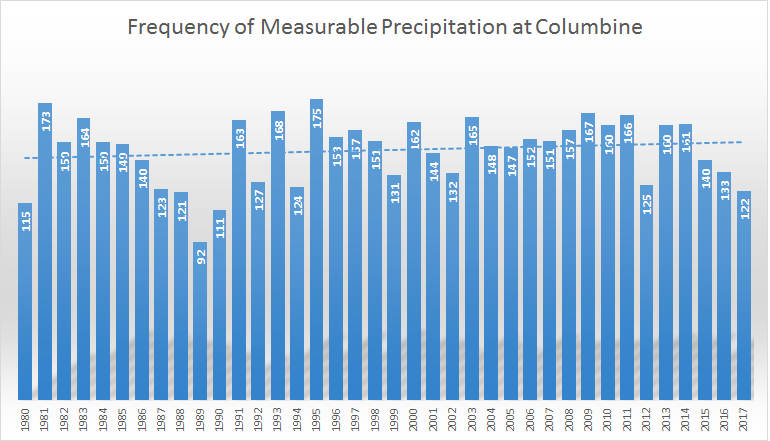
If this is true for most sites, and is, we are left with the jetstream may be shifting north but has yet to cause us fewer precipitation events, and therefore isn't the root cause of less snowpack.
We are still left with: the storm frequency is unchanged, precipitation totals are down, and temperatures are up. This just sounds like an ocean-related situation.
Further, there will be a drought feedback issue with dust. Yes, I said dust. You see, in periods of drought over the Southwestern US, there will be higher occurences of dust in the atmosphere. Dust that may settle onto Colorado's Snowpack and that changes the snowpack's albedo to allow a quicker melt. That is a contributing factor to consider in this too. Here's a feature article with more.
Considerations - El Nino/La Nina
It should be considered that we are in some sort of multi-decadal pattern that would indicate the trend of less total precipitation. Let's take a look at climate signals now.
Here's an example of comparing the snowpack to El Nino and La Nina phases. The statistical correlation between statewide snowpack and ENSO signal (I'm using the MEI here) is poor.
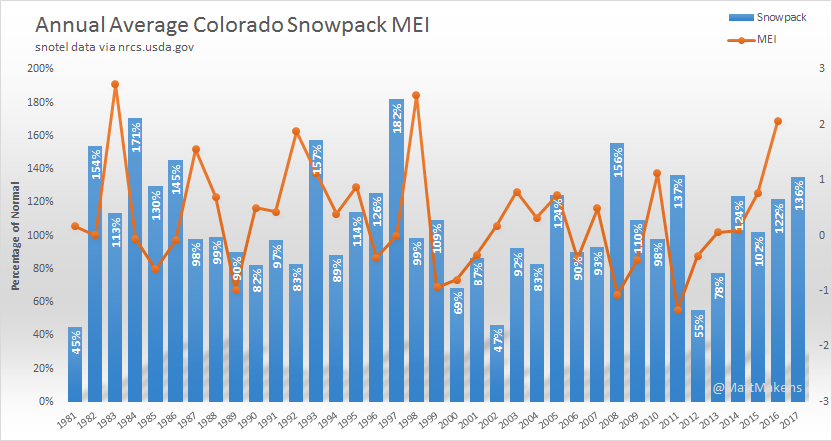
The correlation only increases slightly for individual basins.
The correlation increases a bit more for individual clusters of SNOTEL sites within the larger basin regions. So, on an isolated mountain range scale there is at least some correlation.
Just looking at the statistical correlation coefficient may not indicate the full strength of ENSO's impact. Remember a couple years ago when I wrote this piece? A Closer look at What El Niño Means for Rain and Snow in Colorado. In that study, I showed La Niña winters are the preferred moisture patterns to be in.
The frequency of wet winters is higher when there's a La Niña present. And the stronger the La Niña phase, the stronger the frequency numbers are for a wet period.
The opposite is true of El Niños; most are dry and a stronger El Niño doesn't help.
In the spring timeframe, neither El Nino or La Nina is of great benefit. El Nino produces good moisture only half the time and La Nina rarely will.
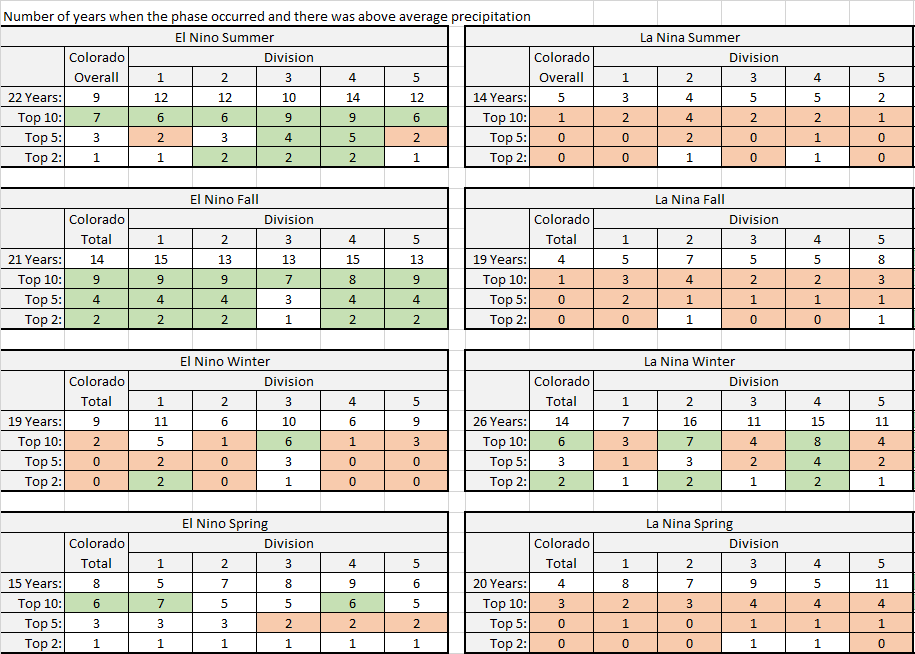
So for great snow numbers, we need La Niña to be in place and strong for the winter to get above average precipitation in the mountains.
Sadly for snow lovers, the trend is against you with fewer La Niña years and a trend toward a greater frequency of El Niño events (not only since 1980 but since 1950).
Oh, but there's more...
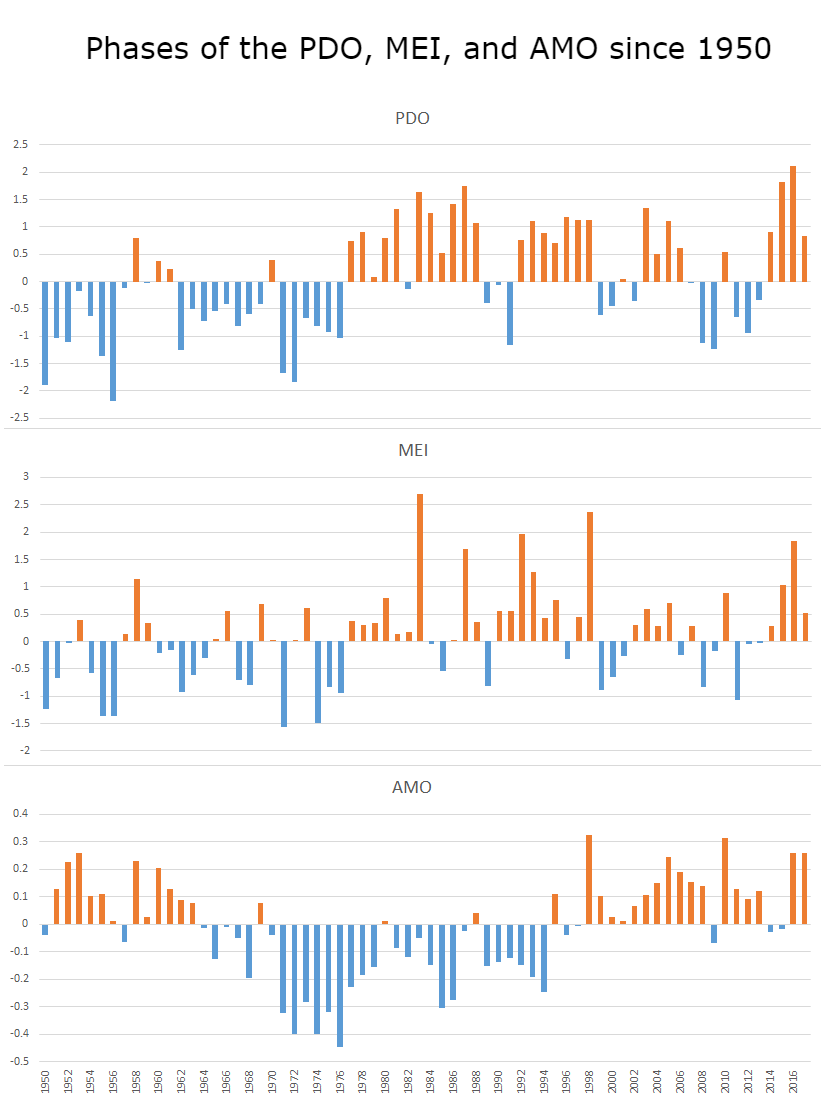
Considerations - PDO/AMO
I think there is also a possible explanation to all of this made by the drought signal – the combined PDO/AMO pattern - in our decreasing snowpack numbers. Again, it relates to the oceans, as before with ENSO.
*(PDO - Pacific Decadal Oscillation. AMO – Atlantic Multi-Decadal Oscillation.)
We've discussed, on Weather5280, the importance of the combined effect of PDO and AMO on the drought frequencies across the US. That could help explain the negative trend in total precipitation in the past few decades.
When tracking the PDO and AMO phases, matched or the opposite, they will produce different precipitation patterns across the country. And, the case of this gets stronger when you add ENSO to make a trifecta.
Going back to the original topic, looking at Colorado's snowpack based on each possible phase combination of the three oscillations we can see a preference.
(A negative phase is a cold phase and a warm phase is positive)
Colorado gets much better snowpack when we are in a negative PDO/MEI and positive AMO phase. We don't do well when PDO is negative and MEI/AMO are positive or when PDO/MEI are positive and AMO is negative.
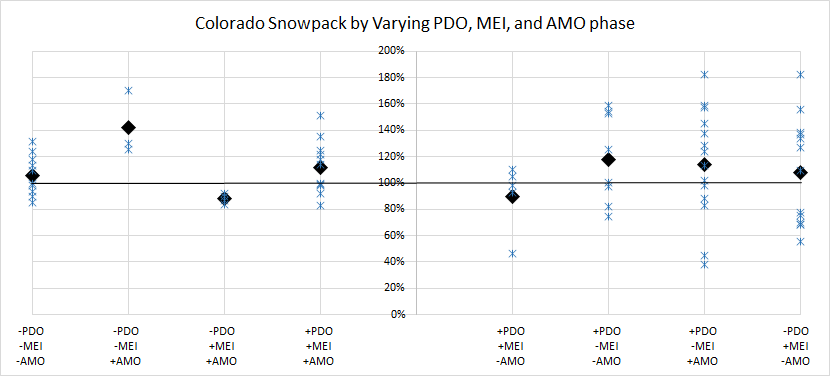
Also, note how little variation there is when all three are negative phased versus a positive(warm) phase of PDO/AMO when MEI is in a cold phase.
Let's look at the three and note that the snowfall (and rainfall for that matter) favored pattern of -PDO, -MEI, +AMO has not occurred for an extended time in decades. Rather, we have seen patterns that will favor average or below snowpack and with greater variation of totals. Isn't that what we've noted recently?
Wrapping Up
With all of this said, in looking at the available SNOTEL data as the best estimate of Colorado's snowfall history, there does appear to be a downward trend in our snowpack annually, but with multi-year variations. Further, there is a decrease (at roughly the same rate) in total precipitation through the snow season.
The strongest linkage to our local snowpack is the phase combination of PDO and AMO with MEI factored in too.
Correlation is not perfect, so there are a lot of factors to weigh in. We've noted the possibility of globally/regionally warmer temperatures sending the storm track to the north, however, our precipitation frequency remains the same over time. Our region is drier and yet just to our north is wetter so we aren't seeing a total atmospheric change toward less snow/precipitation.
I really wish we had a much longer period of record. With another 100 years or so I strongly feel we would see a higher correlation in our snowpack to the PDO, AMO, and MEI cycles.
For now, there is a predictability that comes from knowing what I've just discussed. We know the possible total snowpack variations a pattern can bring and the possibility, based on past frequency, of having above or below average precipitation.
To close, the current climate model projections and ocean patterns indicate a +PDO/+MEI/+AMO pattern for us this season. Historically, we end with above average snowpack much more often than not, and those occurrences that were lower than average were still very close to 100% snowpack as defined by NRCS.
Let's see how the season goes. We'll revisit this post in June and see how the season compared to history.