Colorado weather: Active finish to May and start to June?

While we've had some severe storms in Colorado this spring, and some have been pretty rough, we haven't seen a lot of severe weather. However, we are entering the traditional peak severe weather time for eastern Colorado. Historically speaking, the next 30-45 days is the peak of severe weather season for eastern Colorado. We can still get severe storms after this upcoming period, but the next month and a half is the traditional peak.
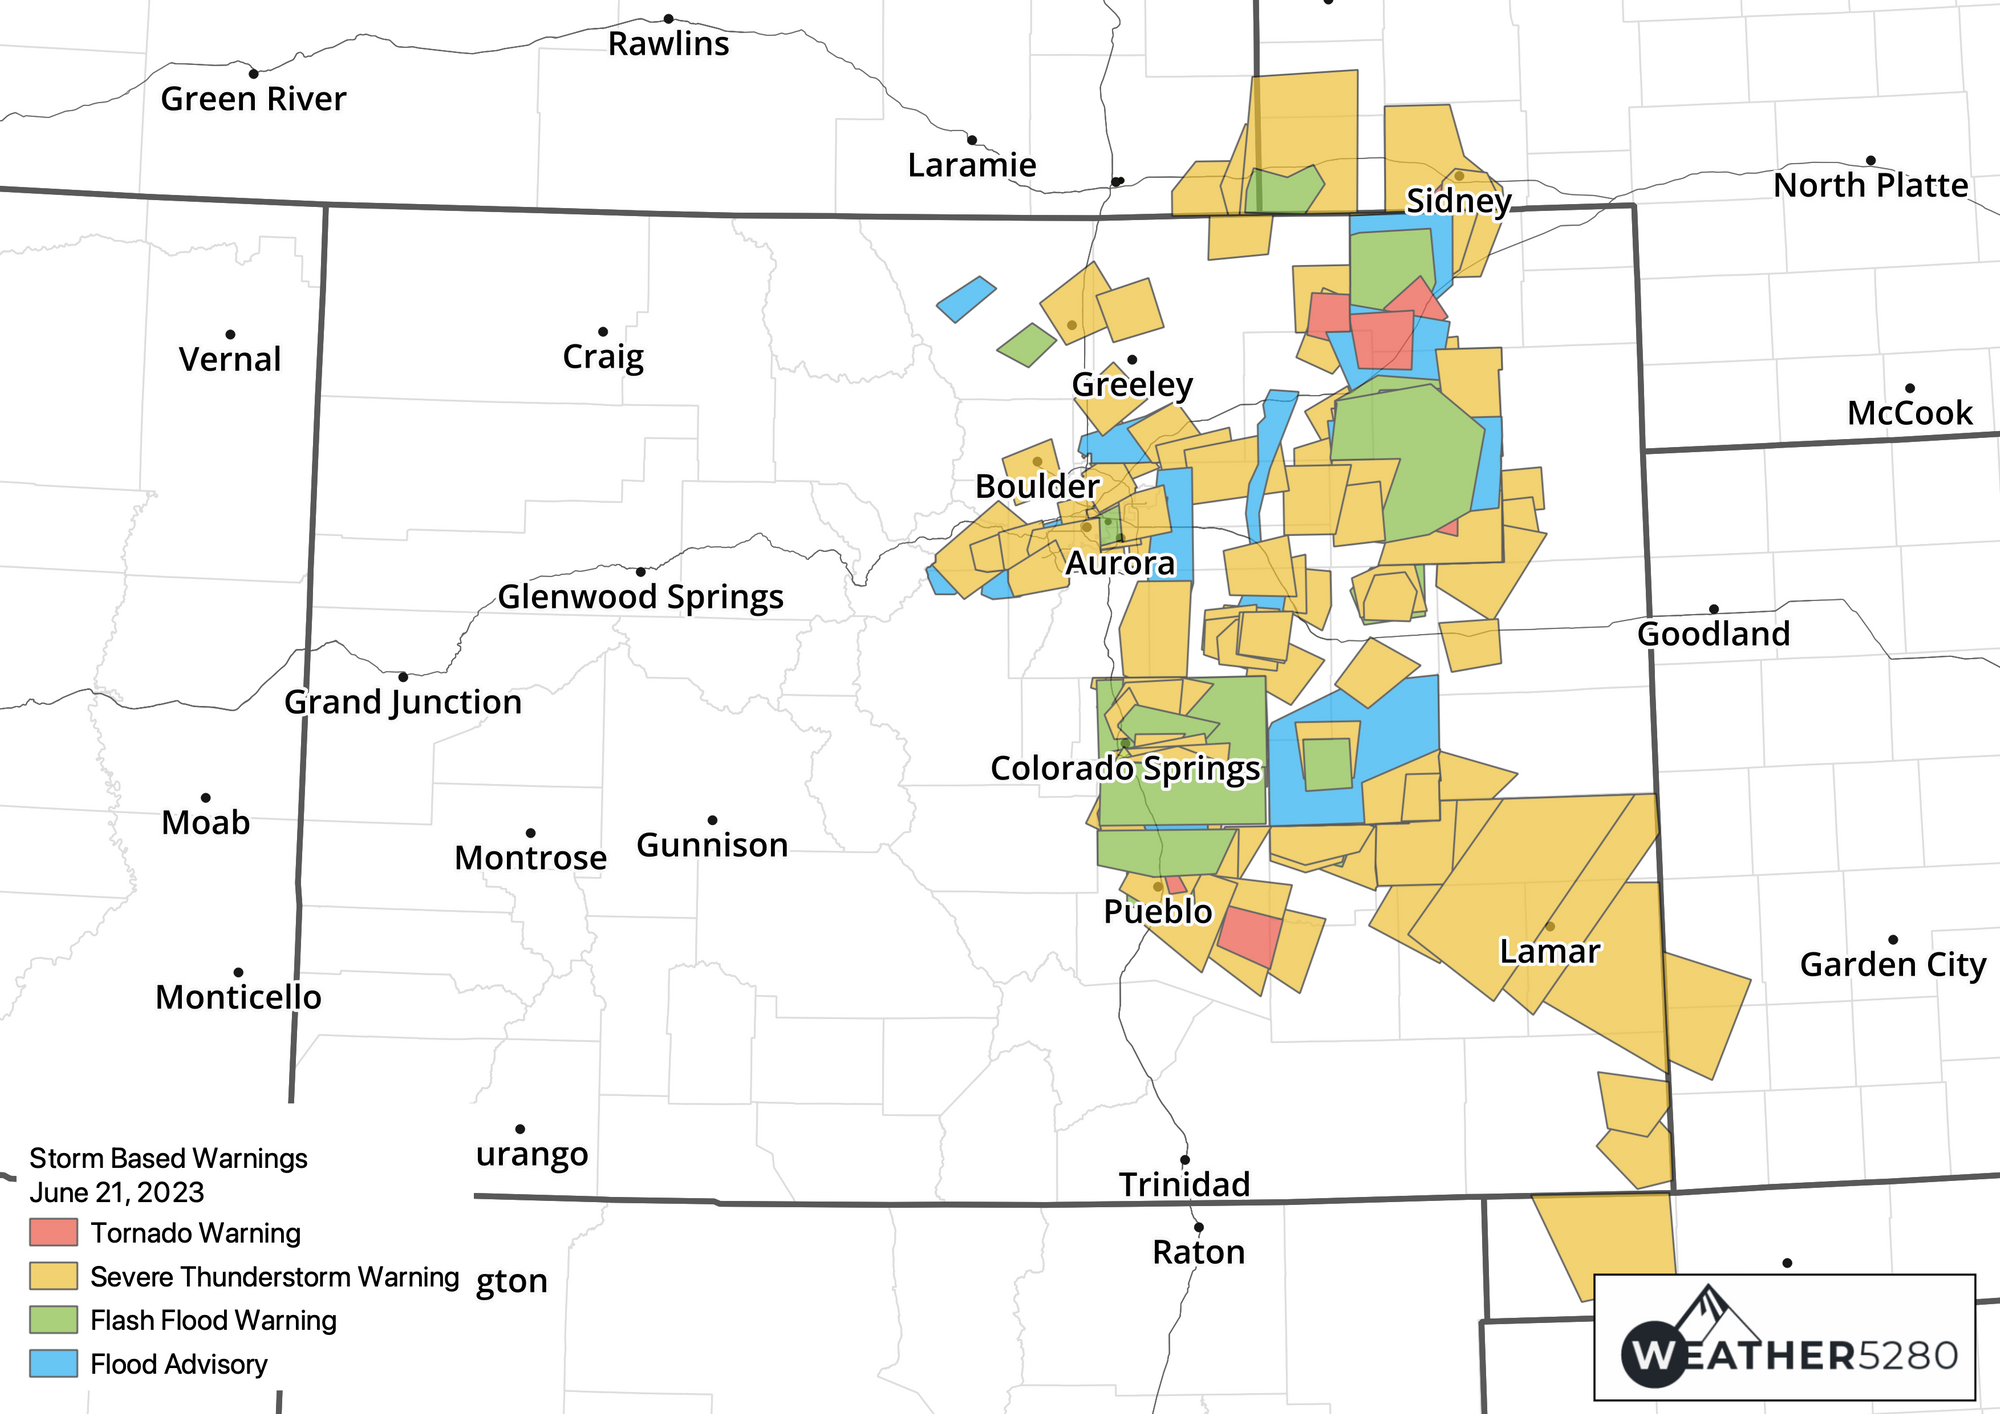
Last June was something. One of more significant severe events in recent memory happened on June 21st...remember Red Rocks? Here is the reminder of what happened that day not just at Red Rocks, but across the state: https://www.weather.gov/bou/Tornadoes_June_21_2023.
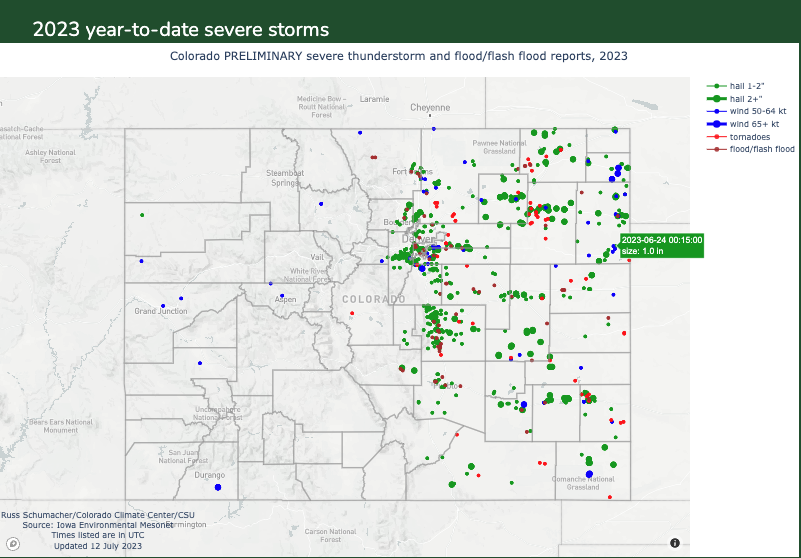
The map below also shows all the severe weather reports that occurred last spring through July 12th. It was an impressive stretch to say the least:
So, will the pattern change enough to bring that threat into the forecast? I have reason to believe that while it likely won't be as active as last June, we will start getting more severe weather. Here is why...
The animation below shows the upper level weather pattern from Tuesday, May 28th through Wednesday morning, June 5th. This shows the wind direction and speed in the mid levels of the atmosphere.
You can see in the animation that there are repeated rounds of higher wind speeds aloft from the west and northwest moving through the region.
This type of setup creates shear in the atmosphere that becomes conducive to producing individual rotating severe thunderstorms and bigger thunderstorm complexes. This is necessary to bring about more widespread storm chances, aside from just the spotty activity that we see from time to time... But, we also need moisture (higher dew points) to provide fuel for those storms.
Dew point temperatures in the 30s and 40s can facilitate severe storms. However, dew points above 50 are often thought of as the benchmark for significant severe storm potential. The animation below is a dew point animation through the same time frame.
You can see the higher dew point air coming farther west, during the animation. That's not to say that drier air won't make it farther east from time to time, but this is likely the best push of sustained moisture this far west so far this season. This doesn't even take into account the various outflow boundaries that will be draped across the region that will serve as focal points for storm generation on various days. This time of year, we can also have "happy accidents"...when severe storms aren't really expected and it happens.
So, we have the following...
- Energy aloft and shear
- Moisture at the surface
- Adequate heating
- Boundaries serving as a focus
- Historically the right time of year for all of this to occur...
This is a pattern that we have been watching for a while and it continues to show itself in the models. While it is still a ways off, and there will likely be changes, it is a trend that certainly has our attention.